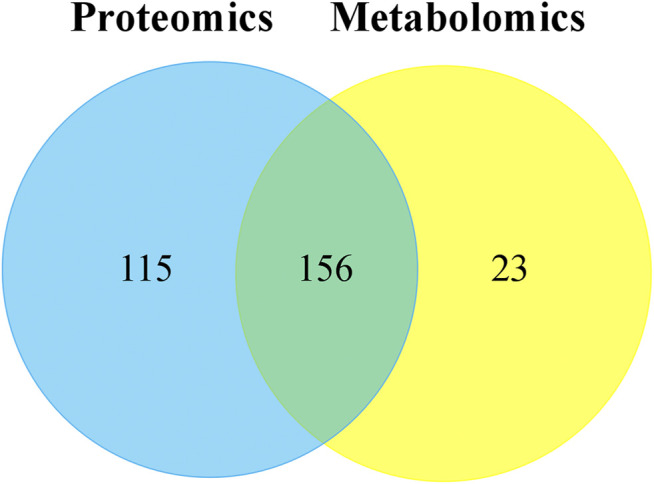
FIGURE 9.

The Venn plot of common pathways of DEPs and DEMs in MC and CPT groups. The blue and yellow circles represent proteomics and metabolomics, respectively. The overlap was the number of pathways shared by the two omics analyzes. The sum of all numbers in the circle represents the sum of the number of pathways involved in DEPs and DEMs.
