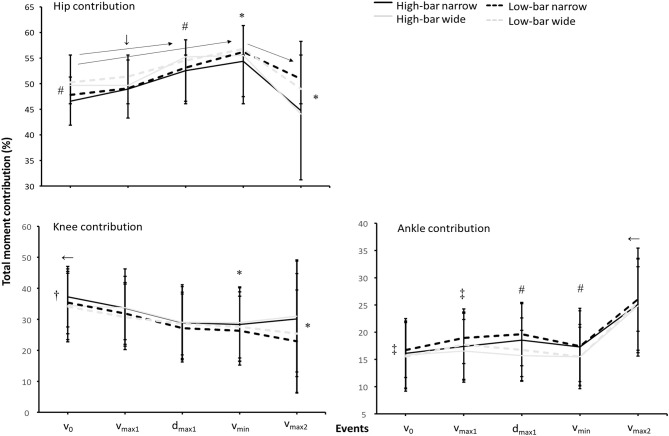
Figure 6.
Mean ± SD total moment contributions for the hip, knee, and ankle joints when both frontal and sagittal are calculated for the HBNS, HBWS, LBNS, and LBWS in the events v0, vmax1, dmax1, vmin, and vmax2 during 3-RM back squats. ← Indicates a significant difference between this event and all other events on a p ≤ 0.05 level. → Indicates a significant difference between these two events on a p ≤ 0.05 level. # Indicates a significant difference between wide and narrow stance widths for this event on a p ≤ 0.05 level. † Indicates a significant difference between the HBNS and all other conditions for this event on a p ≤ 0.05 level. * Indicates a significant difference between high-bar and low-bar barbell placements for this event on a p ≤ 0.05 level. ↓ Indicates a significant difference between the LBWS and all other conditions for this event on a p ≤ 0.05 level. ‡Indicates a significant difference between the LBNS and all other conditions for this event on a p ≤ 0.05 level.

