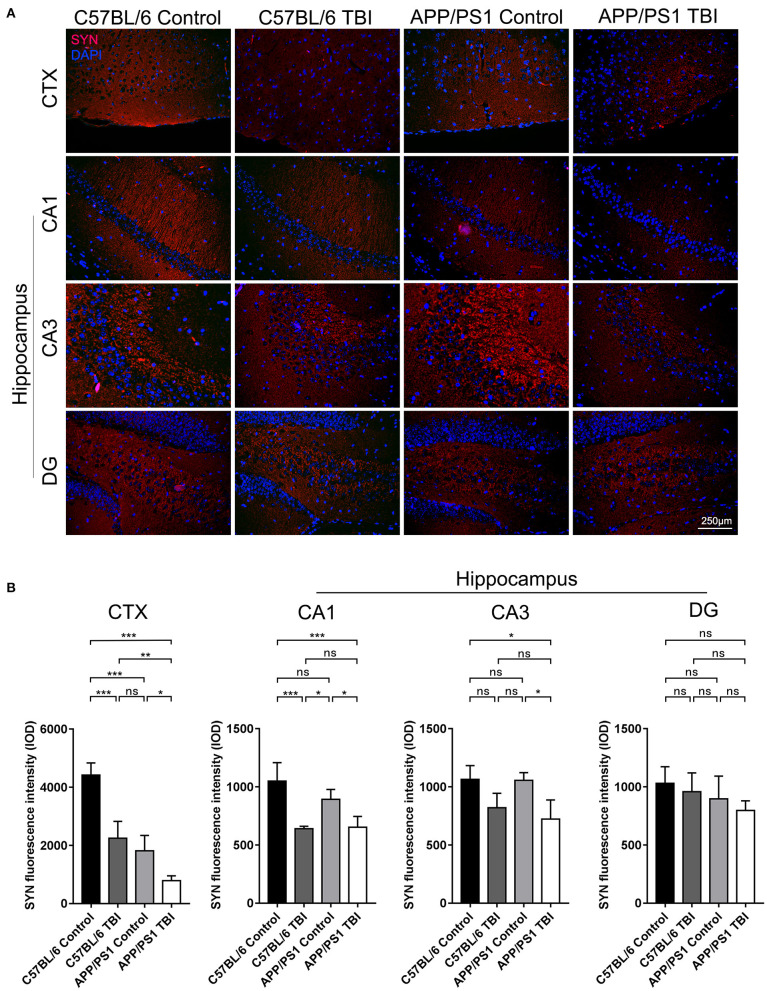
Figure 3.
Synapse formation in the cortex and hippocampus deteriorated in APP/PS1 mice after TBI. (A) Representative fluorescence images of cortical and hippocampal (CA1, CA3, and DG) tissues from in C57BL/6, C57BL/6 TBI, APP/PS1, and APP/PS1 TBI group mice immunostained for SYN (in red) and subjected to nuclear staining with DAPI (in blue). (B) The fluorescence intensity of SYN in the cortex and in the hippocampus (CA1, CA3, and DG). The error bars represent the SEM (n = 8/group). ns, non-significant; *p < 0.05; **p < 0.01; ***p < 0.001.

