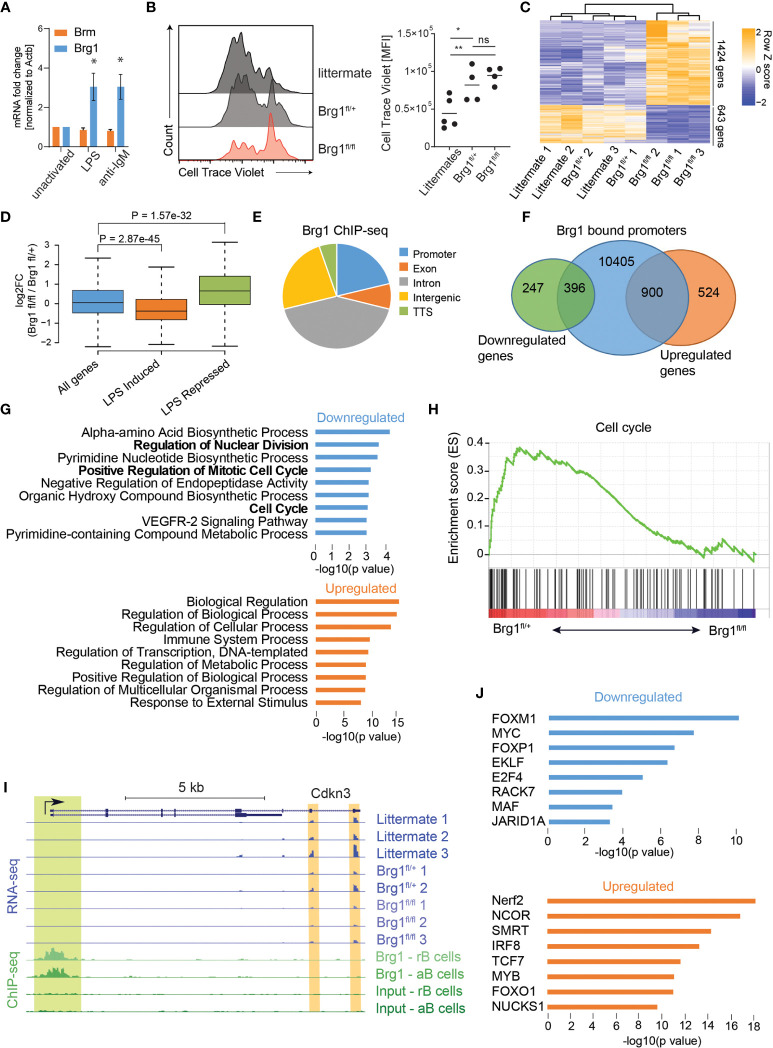
Figure 1.
Brg1 regulates the expression of cell cycle genes in activated B cells (A) qRT-PCR analysis of Smarca2 and Smarca4 mRNA levels of B cells following treatment with anti-IgM or LPS for 2 days, n = 3 mice, * p<0.05 in a one-sample t-test compared to unactivated cells. (B) Flow cytometric analysis of splenic B cell proliferation following 72 hours of LPS and IL-4 activation. MFI of CellTrace Violet cell tracker dye is shown and quantified. Each dot represents one mouse. Statistics were calculated with one-way ANOVA with post hoc Tukey’s multiple comparisons test. p<0.05 = *; p<0.01 = **; p>0.05 = ns (not significant). (C) Heat map representation of clustering analysis of differentially expressed genes. All genes with padj<0.05 and fold change of at least 2 are shown. (D) Boxplots indicating the median, quartiles, and 5th and 95th percentiles of changes in expression levels of CD23-Cre Brg1fl/fl compared to Brg1fl/+ B cells in genes induced or repressed following LPS activation compared to total genes. P value was calculated by a two-sided Wilcoxon rank sum test. (E) Distribution of 70,333 Brg1-binding sites across genomic regions in LPS activated B cells. TTS: transcription termination site. (F) Venn diagram showing overlap between 11,701 Brg1 bound promoters, 1,424 genes upregulated in Brg1fl/fl compared to Brg1fl/+ cells, and 643 genes downregulated in Brg1fl/fl compared to Brg1fl/+ cells. (G) GO terms which were enriched in genes whose promoters were bound by Brg1 and were down- or upregulated in CD23-Cre Brg1fl/fl compared to Brg1fl/+ B cells. (H) Gene set enrichment plot for cell cycle genes from the hallmark gene sets. (I) UCSC genome browser tracks showing the locus of Cdkn3 (padj < 0.05). Tracks show the expression levels, measured by RNA-seq, in activated B cells and ChIP-seq signal of Brg1 in resting and activated B cells, compared to input controls. Green highlight: binding of Brg1 in the promoter region. Orange highlights: 3’ end exons covered by RNA-seq. (J) Transcription factors enriched for binding the promoters of genes which were bound by Brg1 and were down- or upregulated in Brg1fl/fl compared to Brg1fl/+ cells.

