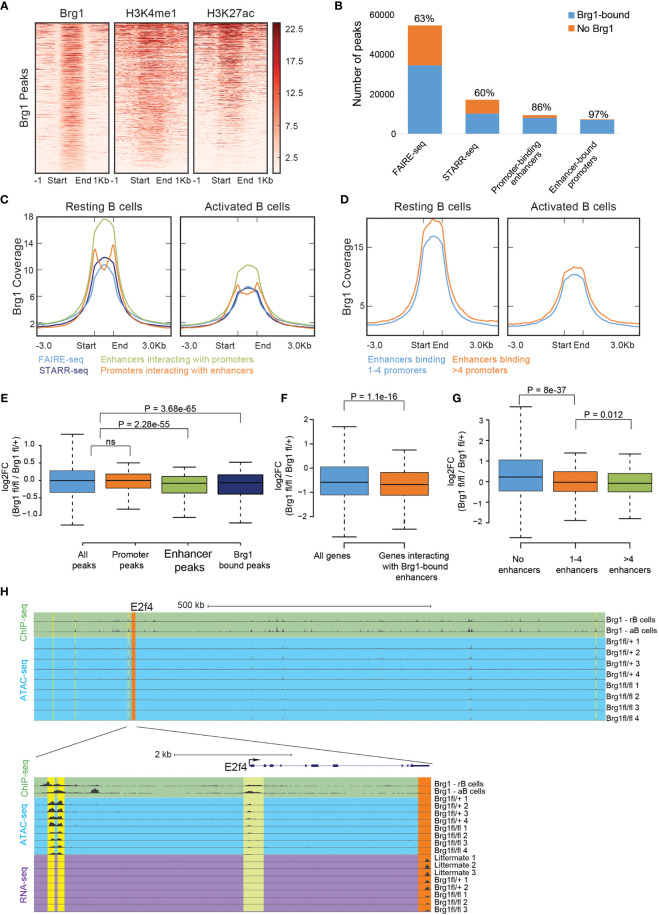
Figure 2.
Brg1 recruitment to multiple enhancers is associated with transcriptional activation of their coupled promoters. (A) Density of ChIP-seq reads for Brg1, H3K4me1, and H3K27ac in activated B cells. Plots show ±1 kb around the midpoint of each Brg1-enriched region ranked according to Brg1 density. (B) The numbers of FAIRE-seq peaks, STARR-seq peaks, promoter-binding enhancers, and enhancer-bound promoters, and the fraction of each group that overlaps Brg1 bound genomic regions. (C) Averaged tag densities of Brg1 are plotted across all FAIRE–seq peaks, STARR-seq peaks, promoter-binding enhancers, and enhancer-bound promoters, in resting and activated B cells. (D) Averaged tag densities of Brg1 are plotted across enhancers binding 1-4 promoters compared to enhancers binding >4 promoters, in resting and activated B cells. (E) Boxplots indicating the median, quartiles, and 5th and 95th percentiles of changes in ratios of ATAC-seq signal for the indicated group of peaks, comparing CD23-Cre Brg1fl/fl cells to Brg1fl/+ B cells; p>0.05 = ns (not significant). (F) Boxplots indicating the median, quartiles, and 5th and 95th percentiles of changes in expression levels of Brg1fl/fl cells compared to Brg1fl/+ cells in genes whose promoters interact with Brg1 bound enhancers compared to all genes. P-value was calculated by the two-sided Wilcoxon rank-sum test. (G) Boxplots indicating the median, quartiles, and 5th and 95th percentiles of changes in expression levels of CD23-Cre Brg1fl/fl cells compared to Brg1fl/+ cells in genes whose promoters interact with 1-4 enhancers or with more than 4 enhancers, compared to genes whose promoters were not found to interact with active enhancers. P values were calculated by a two-sided Wilcoxon rank-sum test. (H) Top: UCSC genome browser tracks showing the area around the E2f4 gene, which was significantly downregulated in Brg1fl/fl cells (padj < 0.05). Tracks show the ChIP-seq signal of Brg1 in resting and activated B cells and ATAC-seq coverage in activated B cells. Orange highlight: E2f4 gene. Yellow highlights: enhancers which were found to interact with the promoter of E2f4. Bottom: zoom-in to the E2f4 locus, showing ChIP-seq signal of Brg1 in resting and activated B cells, ATAC-seq coverage and expression levels measured by RNA-seq. Green highlight: binding of Brg1 in the promoter region of E2f4. Orange highlight: 3’ end exons covered by RNA-seq. Yellow highlights: enhancers which were found to interact with the promoter of E2f4. rB cells, resting B cells. aB cells, activated B cells.

