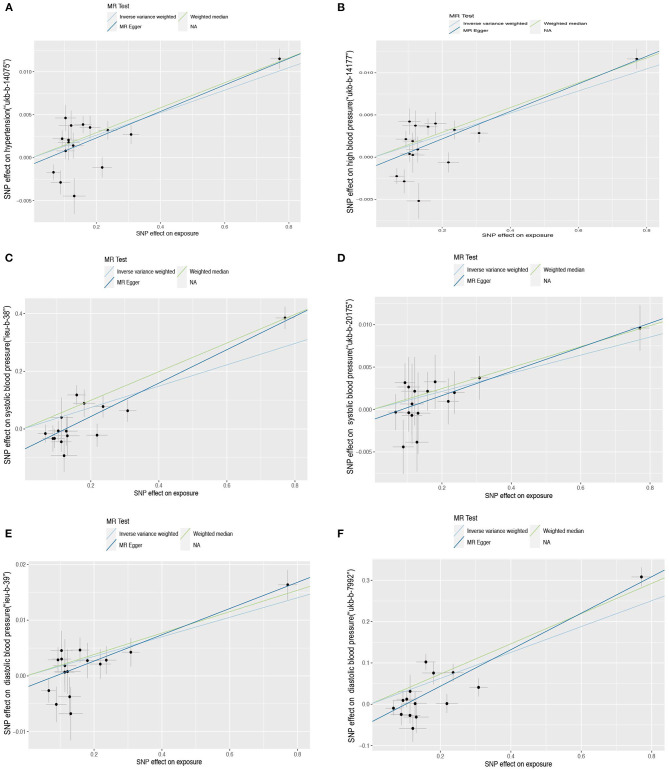
Figure 3.
Scatter plot of the Mendelian randomization (MR) outcome. Relationship between the effect size estimates on sUMOD (x-axis) and the effect size estimates on outcomes (y-axis): Hypertension (A,B), systolic blood pressure (C,D), diastolic blood pressure (E,F). The slope of fitted lines represents the estimated causal effect of sUMOD obtained using the inverse variance weighted (IVW), MR-Egger, and weighted median (WM). Hypertension: (A) (ukb-b-14177), (B) (ukb-b-14-57); systolic blood pressure: (C) (ieu-b-38), (D) (ukb-b-20175); diastolic blood pressure: (E) (ieu-b-39), (F) (ukb-b-7992).

