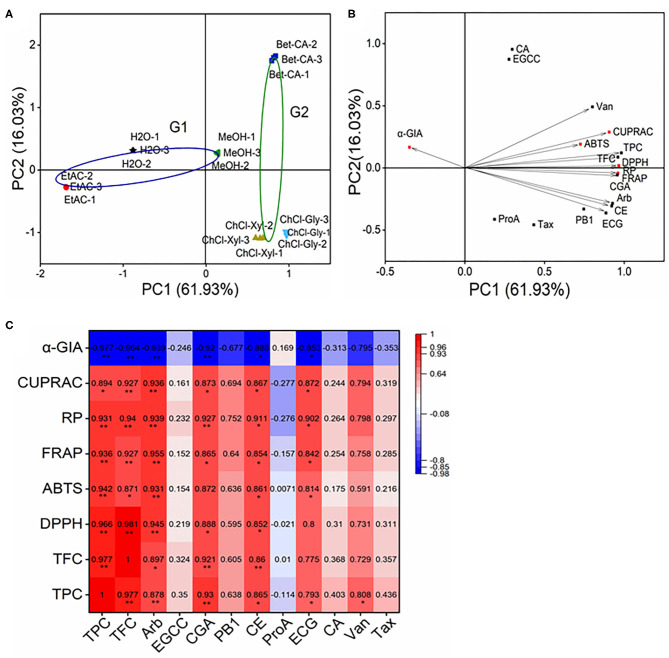
Figure 5.
Principal component analysis (PCA) and correlation matrix of CIOPs extracts. (A), PCA score plot; (B): PCA loading plot. (C): Heatmap analysis of correlation matrix. Arb, arbutin; EGCC, (–)-epigallocatechin; CGA, chlorogenic acid; PB1, procyanidin B1; CE, (+)-catechin; ProA, protocatechuic acid; ECG, epicatechin; CA, caffeic acid; Van, vanillin; Tax, taxifolin.

