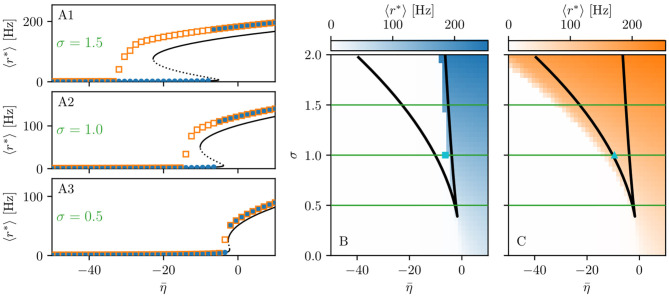
Figure 1.
Phase and bifurcation diagrams for subject H1. (A1–A3) Equilibrium firing rates 〈r*〉 vs. for the up sweep (blue dots) and down-sweep (orange squares). For each in steps of , the system is initialized using the final state of the previous run and evolves for 2 s after which the average network firing rate in the equilibrium state is determined. Different panels correspond to different σ values: σ = 1.5 (A1), σ = 1 (A2), and σ = 0.5 (A3). The solid (dashed) black line corresponds to the stable (unstable) equilibria in the single-node case. Maps of regimes as a function of σ and showing the network average 〈r*〉 color-coded for up- (B) and down-sweep (C), obtained by following the same procedure as in (A1–A3) for σ ∈ [0, 2] in steps of Δσ = 0.05. The black line indicates the single-node map of regimes like in Montbrió et al. (2015). In panels (B,C) the cyan square and triangle mark , respectively. Parameter values: Npop = 90, τm = 20 ms, Δ = 1, Jkk = 20, .

