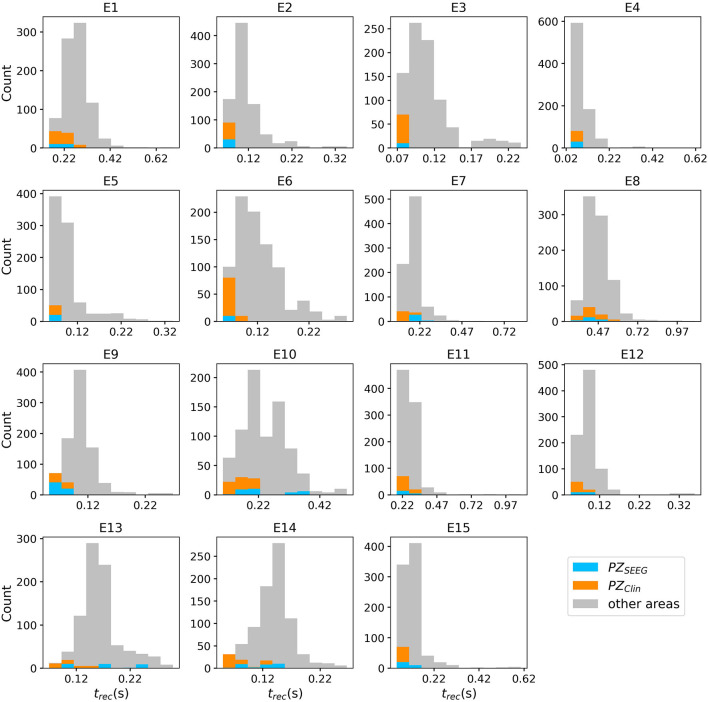
Figure 11.
Histograms of recruitment times for all patients with epileptic. For each patient (identified by his/her number), the recruitment times of all the brain areas are collected, once the EZ is stimulated. If several areas were identified in the EZ, they are all stimulated simultaneously. The EZ is chosen according to the presurgical evaluation (as shown in Supplementary Table 4) and vary from one patient to the other. Parameters as in Figure 10 except for (for E1 , for E11 ). Results are averaged over 10 repetitions of different random Gaussian distributions.

