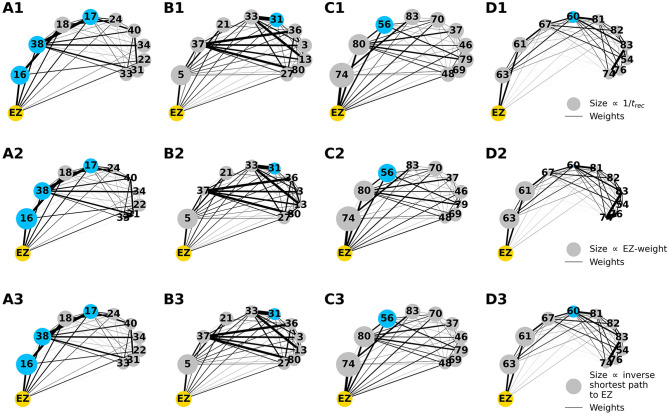
Figure 12.
Graph plot of the first 10 recruited areas, ordered clockwise according to their recruitment times, as found via numerical experiments. Node circle size corresponds to the inverse recruitment time (A1–D1), to the connection strength to the EZ (A2–D2), and the inverse shortest path length to the EZ (A3–D3). The size of the yellow EZ remains fixed. Blue dots distinguish a recruited area to belong to the PZSEEG, i.e., the PZ identified according to the presurgical invasive evaluation. Results are obtained for patients E2 (A1–A3), E3 (B1–B3), E6 (C1–C3), and E13 (D1–D3). Parameters as in Figure 10.

