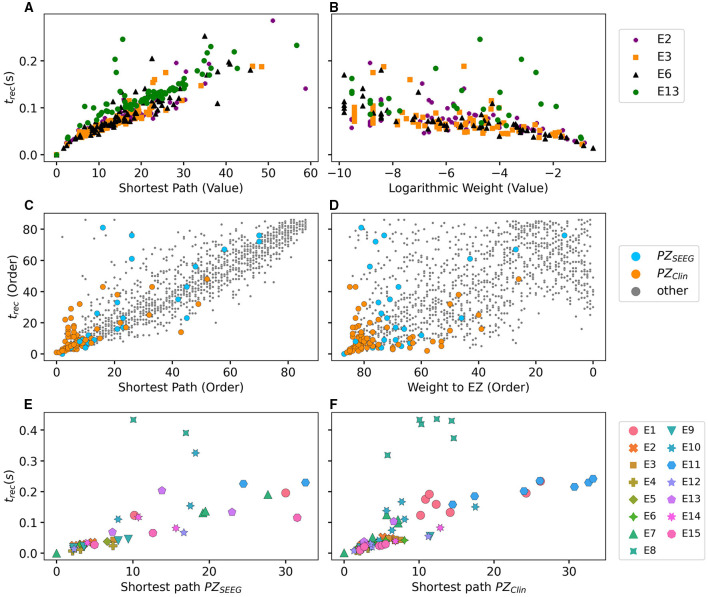
Figure 13.
Relationship between network measure and recruitment time, as found via numerical experiments. (A) Shortest path to EZ; (B) Logarithmic value of the weight to the EZ for the four patients with a single-node EZ. In (A) all four EZs are shown at (0, 0), while in (B) the EZs are omitted. The recruitment time is calculated in seconds after the perturbation current has started. In (C,D) the recruitment time values are plotted according to their order, as a function of the shortest path to EZ (C) and weight to EZ (D) for all 15 patients. In (D) the x-axis was inverted for better comparison. (E) Recruitment times trec of the areas belonging to PZSEEG and (F) PZClin as a function of the shortest path length to EZ, for all 15 patients. For patients with several nodes detected in the EZ, all areas were stimulated simultaneously. Parameters as in Figure 10.

