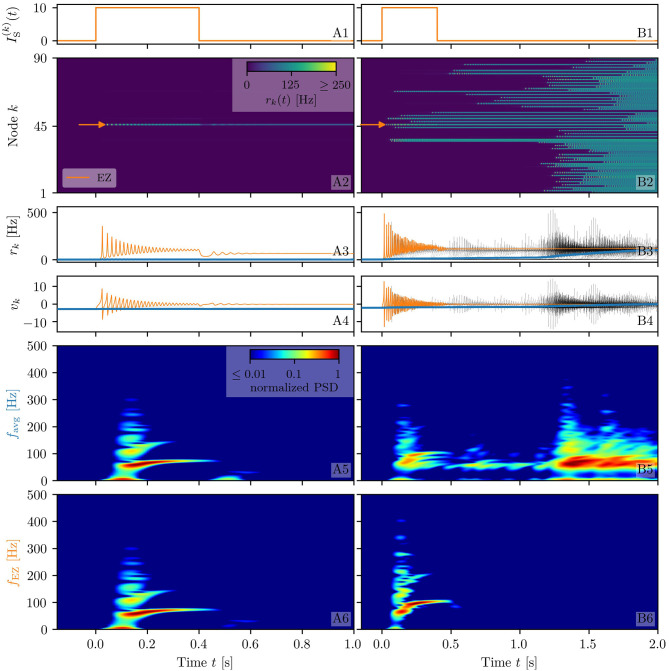
Figure 2.
Spectrograms of mean membrane potentials for healthy subject H1. (A1, B1) Stimulation current , (A3, B3) population firing rates rk , and (A4, B4) mean membrane potentials vk for the EZ (orange) and other populations (black). The blue curves show the network average firing rate and membrane potential. Non-stimulated node dynamics are plotted as transparent gray curves: some of the nodes adapt their voltage to the stimulation of the EZ and change during stimulation. (A2, B2) Space-time plots of the population firing rates rk, color-coding the value of the firing rate of each node, as a function of time. (A5, B5) Spectrogram of the network average membrane potential and (A6, B6) of the vk of the EZ. Column A shows an asymptomatic seizure-like event for , column B shows a generalized seizure-like event for . In both cases, the EZ node 46 is stimulated. Parameter values: Npop = 90, τm = 20 ms, Δ = 1, Jkk = 20, σ = 1, .

