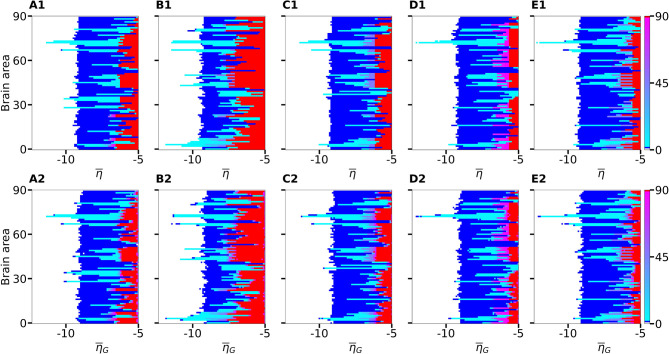
Figure 3.
Number of recruited brain areas as a function of the excitability parameter for five exemplary healthy subject connectomes (A–E). Color coding is the following: blue corresponds to the asymptomatic threshold (one area in HA regime); red represents 90 areas in HA regime (generalized threshold); cyan to purple indicate intermediate recruitment values, white marks no recruitment. When performing a vertical cut, all nodes are characterized by the same for panels (A1–E1). On the contrary, in panels (A2–E2), represents the mean value of a Gaussian distribution with standard deviation 0.1. Therefore, when perturbing one brain area at a time, excitabilities are distributed and not uniform in the latter case; the results are averaged over 10 repetitions with different Gaussian excitability distributions. (A–E) correspond to subjects H1, H5, H12, H16, and H19. Parameters: Npop = 90, Δ = 1, σ = 1, IS = 10, tI = 0.4 s.

