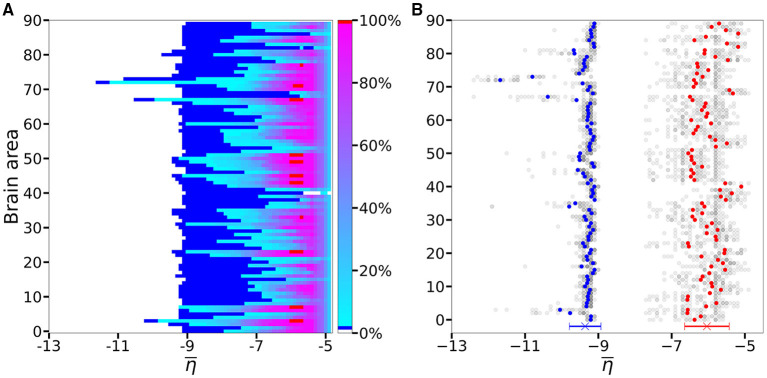
Figure 4.
(A) Number of recruited brain areas as a function of the excitability parameter , as shown in Figures 3A1–E1, averaged across all subjects. (B) threshold values for asymptomatic and generalized seizure-like events. Gray dots show the thresholds for each brain area and each subject. Blue and red dots show the average over and across all subjects. The blue and red cross at the bottom shows the average value and its standard deviation for both thresholds across all subjects and all areas. Parameters as in Figure 3.

