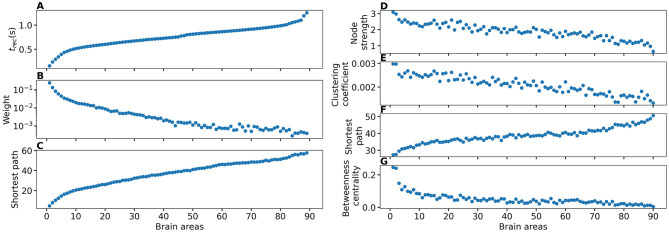
Figure 6.
(A) Recruitment times reported in descending order: Brain area 1 is the brain area that is recruited first and brain area 90 is the last recruited brain area. (B) Connection weights between the recruited brain area and the EZ, ordered according to their recruitment time, thus following the indexing of (A). (C) Shortest path between the recruited area and the EZ, ordered according to their recruitment time. (D) Connection weights between the recruited brain area and all the nodes except EZ, ordered according to their recruitment time. (E) Clustering coefficient between the recruited brain area and all the nodes except EZ, ordered according to their recruitment time. (F) Shortest path between the recruited area and all the other nodes except EZ, ordered according to their recruitment time. (G) Betweenness centrality between the recruited brain area and all the nodes except EZ, ordered according to their recruitment time. The excitability is set to the subject-specific threshold , according to Figure 3B for each subject separately. Data are averaged over all subjects and all the stimulated areas. Parameters: Npop = 90, Δ = 1, σ = 1, IS = 10, tI = 0.4 s as in Figure 3.

