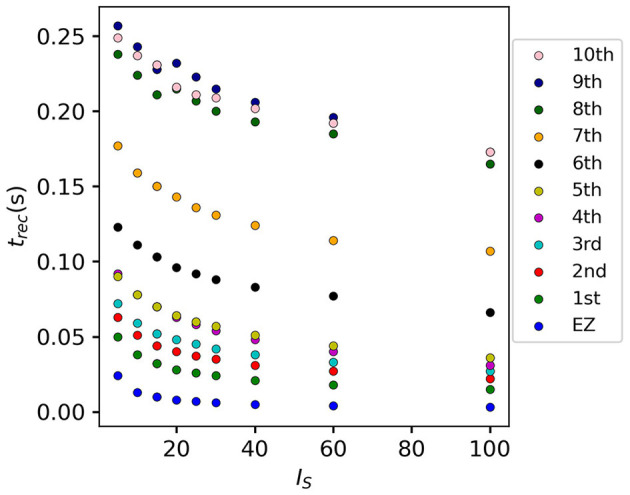
Figure 7.

Recruitment times of the first 10 recruited areas as a function of the input current IS. The strength of the input current is varied between 0 and 100 on the x-axis. The order of the recruitment is color-coded for each current strength, and it changes slightly with different current strengths. Parameters: Npop = 90, Δ = 1, σ = 1, tI = 0.4 s, , stimulation site: brain area k = 45 of subject H1.
