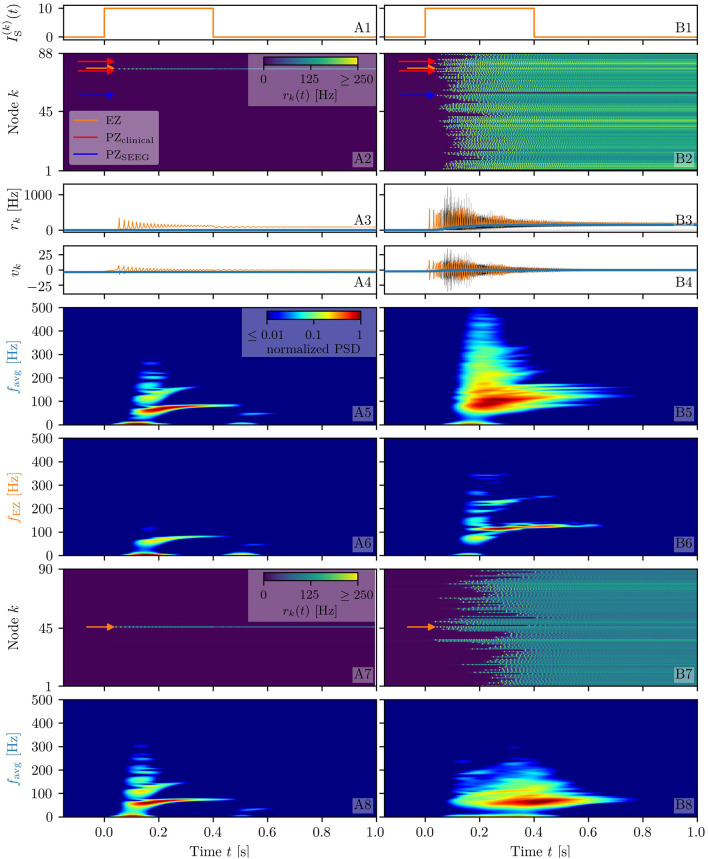
Figure 9.
Spectrograms of mean membrane potentials for patient E6. (A1, B1) Stimulation current , (A3, B3) population firing rates rk, and (A4, B4) mean membrane potentials vk for the EZ (orange) and other populations (black). The blue curves show the network average firing rate and membrane potential. (A2, B2) Space-time plots of the population firing rates rk, color-coding the value of the firing rate of each node, as a function of time. (A5, B5) Spectrogram of the network average membrane potential and (A6, B6) of the vk of the EZ. Column A shows an asymptomatic seizure-like event for , column B shows a generalized seizure-like event for . The EZ node 77 (rh-PrG) is stimulated. Parameter values: Npop = 88, τm = 20 ms, Δ = 1, σ = 1.25, Jkk = 20, . For comparison are shown the space-time plots of the population firing rates rk (A7, B7) and the spectrogram of the network average membrane potential (A8, B8) for healthy subject H2. In accordance with the above panels, column A shows an asymptomatic seizure-like event (for ), column B shows a generalized seizure-like event (for ). The EZ node 46 is stimulated. Parameter values: Npop = 90, τm = 20 ms, Δ = 1, Jkk = 20, σ = 1, .

