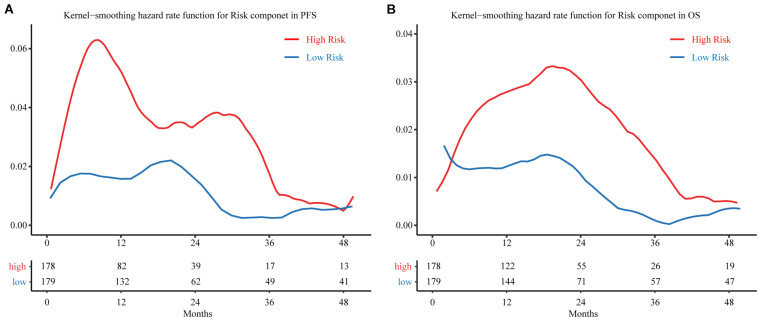
FIGURE 5.
Hazard curves revealing the time of cancer progression. Smoothed hazard estimates for the presence of a risk component in (A) PFS and (B) OS. The red line represents patients in the high-risk group, and the blue line represents patients in the low-risk group. The table below the curve gives the number of patients without observed endpoint event at different follow-up cut-of time. PFS, progression-free survival; OS, overall survival.

