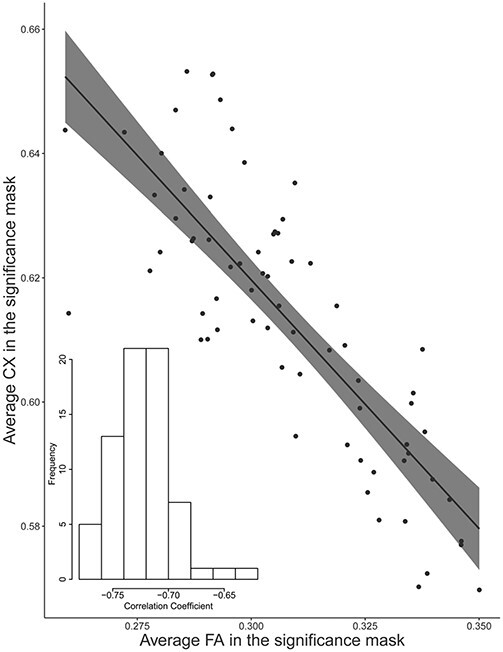
Figure 8 .

Correlation between average FA and average CX within the significance mask across subjects (P < 0.001 and r = −0.81). The bottom left corner contains a histogram displaying the frequency of correlation coefficients between FA and CX across voxels within each subject. The mean correlation coefficient was r = −0.72.
