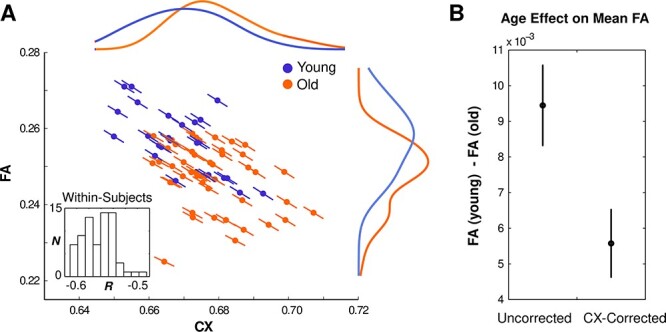
Figure 10 .

Relationship between CX, FA, and age. (A) Correlations between CX and FA across subject means (colored points) and across voxels within each subject (slopes: colored lines; the inset displays a histogram of the distribution of these within-participant correlation coefficients). Colors indicate age group (blue = young; orange = old). Colored curves show interpolated histograms (kernel density plots) of subject means for each group. (B) Observed age differences in mean FA before (left) and after (right) statistically controlling for CX–FA correlations across subjects.
