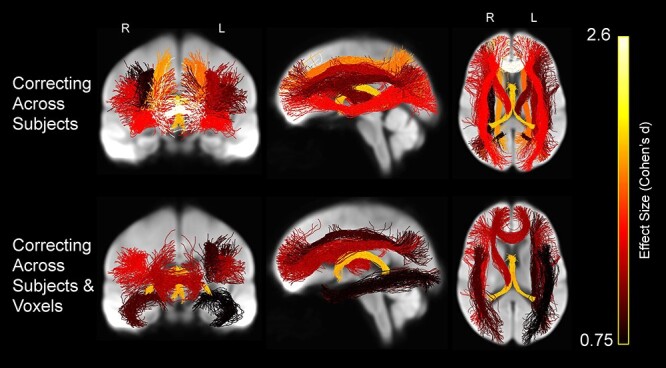
Figure 12 .

Whole-brain projections onto 2D slices showing WM tracts in which average FA was significantly lower in the older versus younger participants after controlling for complexity (FA–CX), displayed on the WM population template. Streamlines within each tract are colored by the tract’s effect size (Cohen’s d), with brighter colors representing greater effect size.
