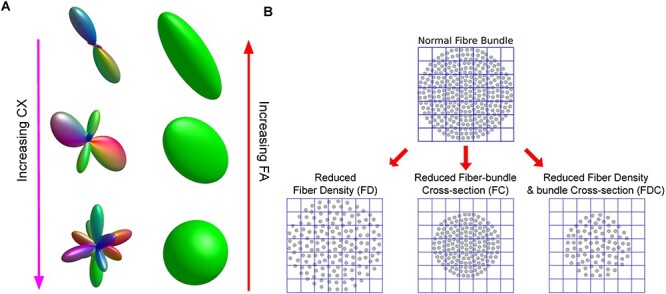
Figure 2 .

Graphical illustration of complexity (CX), FA, FD, FC, and FDC. (A) fOD model and tensor model in the same voxels, in which complexity increases from top to bottom while FA decreases. (B) An illustration of the FBA metrics FD, FC, and FDC adapted from Elsevier: Neuroimage. Investigating white matter fibre density and morphology using fixel-based analysis. Raffelt et al. (2017) under a Creative Commons CC_BY license.
