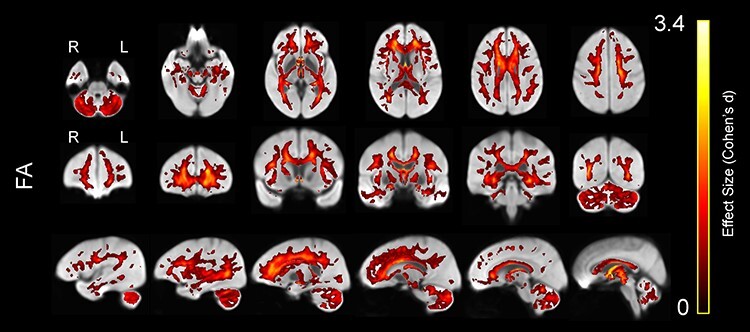
Figure 4 .

Lower WM FA in older compared with younger adults, displayed on the WM population template. Colors represent voxels in which FA was significantly lower in the older compared with the younger group, with brighter colors representing larger effect sizes (Cohen’s d).
