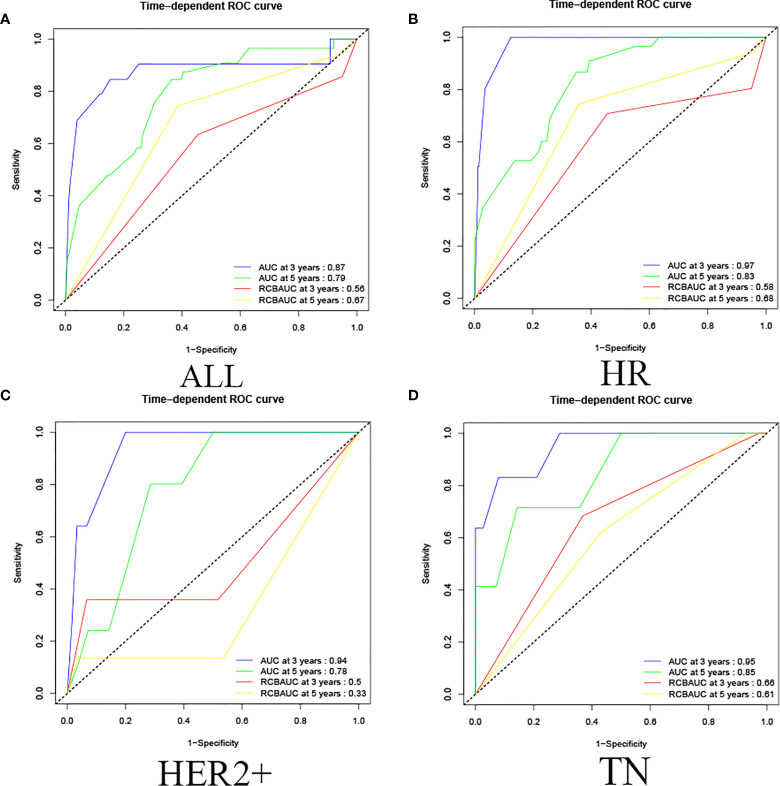
Figure 5.
Validation set ROC curve. (A) Among all cases in the validation set, the prediction model of 3-year survival AUC value was 0.87 and the 5-year survival AUC value was 0.79, and the RCB classification of 3-year survival and 5-year survival were 0.56 and 0.67. (B) In HR, the AUC values of 3-year and 5-year survival rate calculated by the predictive model were 0.97 and 0.83, the RCB classification of 3-year survival and 5-year survival were 0.58 and 0.68; (C) in HER2+, the AUC values of 3-year and 5-year survival rate calculated by predictive model were 0.94 and 0.78, the RCB classification were 0.50 and 0.33; (D) in TN, the AUC values of 3-year and 5-year survival rate calculated by the predictive model were 0.95 and 0.85, and the RCB classification were 0.66 and 0.61.

