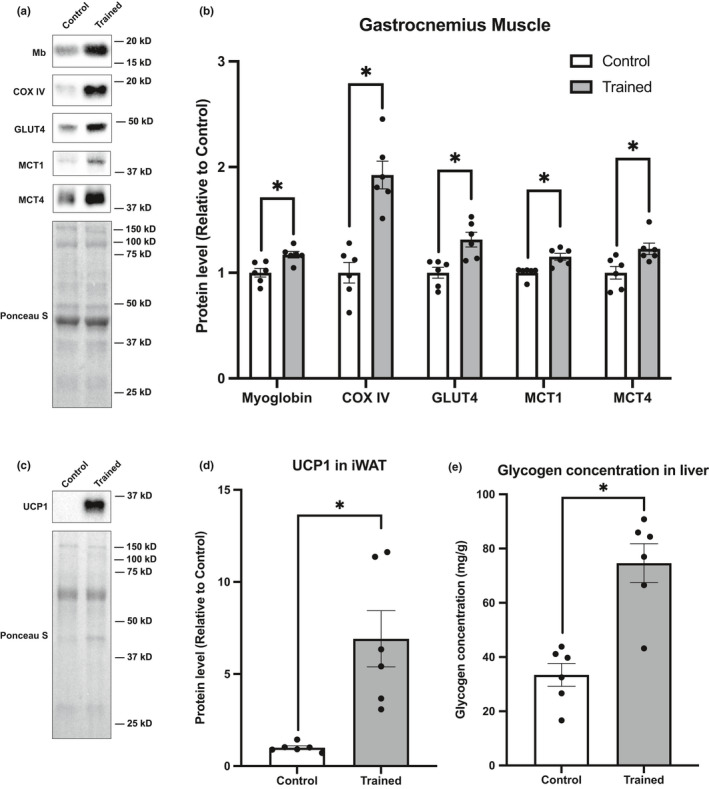
FIGURE 1.

Validation and profiles of endurance training model. (a) Representative blots and (b) protein content of myoglobin, COX IV, GLUT4, MCT1, and MCT4 in gastrocnemius muscle. (c) Representative blots and (d) protein content of UCP1 in iWAT. (e) Glycogen concentration in liver. Data are expressed as mean ± SE. Differences between control and endurance training group were examined using the Mann–Whitney U test. Statistical significance was defined as p < 0.05
