
FIGURE 2.
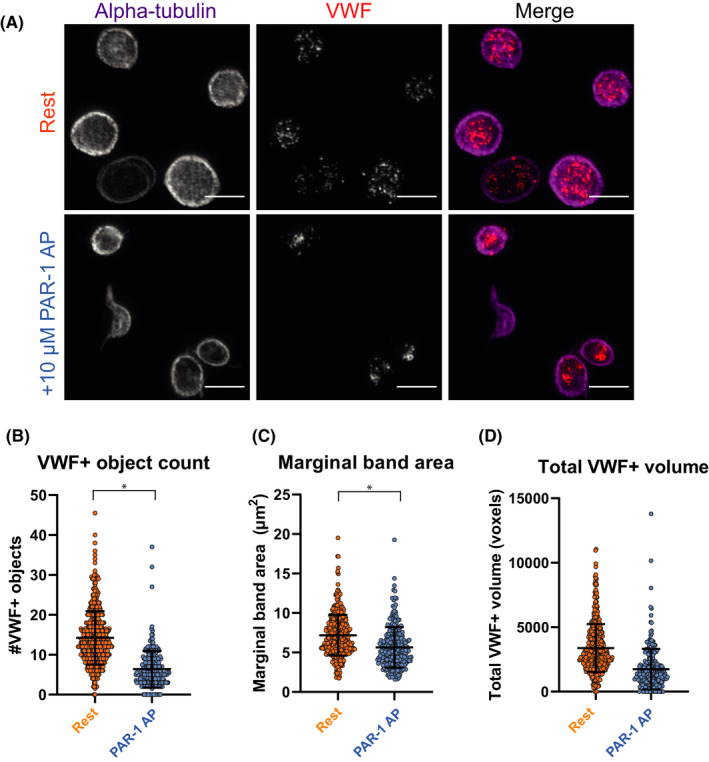
Quantification of granular and morphological changes in activated platelets using structured illumination microscopy. Platelets were incubated with 10 µM proteinase‐activated receptor 1 activating peptide (PAR‐1‐AP; blue) or phosphate buffered saline (PBS; orange, “rest”) for 10 min at 37℃, imaged and processed through our analysis workflow. One representative image of several platelets is shown per condition (A). VWF‐positive object numbers (B) and marginal band area were quantified and compared between resting (n = 663) and stimulated platelets (n = 429) (C). Total VWF‐positive volume was assessed in (D). Data is represented as mean ± standard deviation. Scale bar is 3 µm in panel (A); brightness and contrast were equally amplified for both panels to enhance visibility. *P < .05