
FIGURE 4.
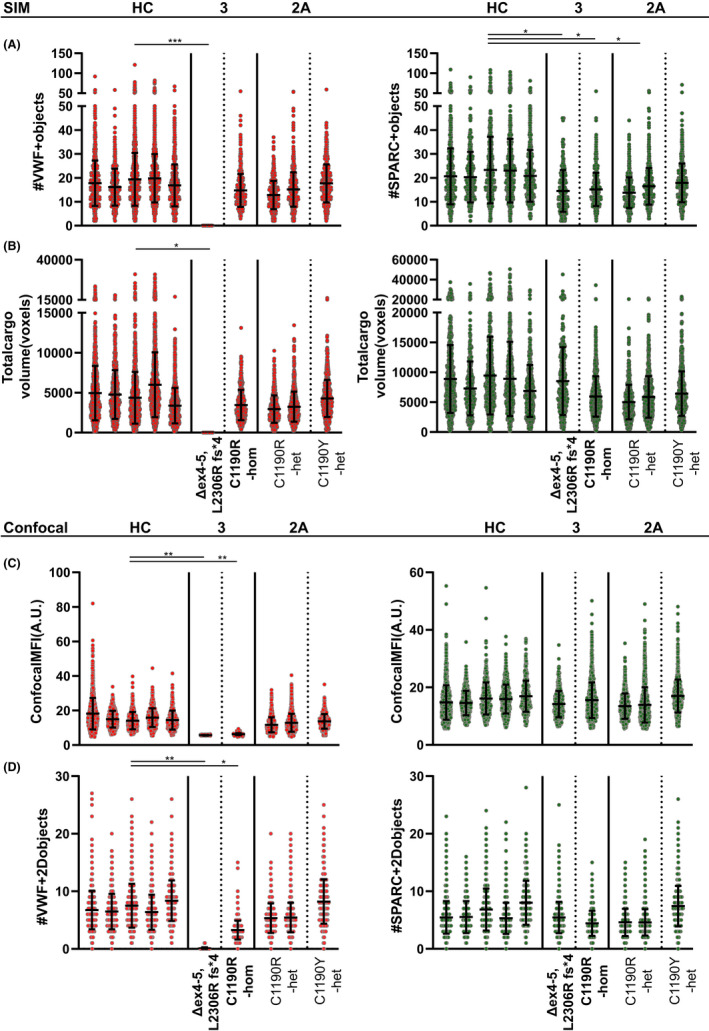
(Previous page) Quantification of α‐granule content of von Willebrand disease (VWD) platelets using super‐resolution and confocal microscopy. Von Willebrand factor (red) and secreted protein acidic and rich in cysteine (SPARC; green) α‐granule cargo was quantified for all patients through 3D structured illumination microscopy (A‐B) and 2D confocal (C‐D) workflows and compared to healthy control platelets (n = 5310 platelets over five donors). Patients with type 3 VWD are marked in bold text (Δex4‐5, L2306R fs*4; n = 290; homozygous C1190R‐hom, n = 578 platelets), while patients with type 2A are nonbold (C1190R‐het (n = 535/921) and C1190Y‐het (n = 749)). Object numbers (A/D) were assessed through both techniques while total volume (B) and mean fluorescence intensity (C) were exclusively measured through SIM and confocal microscopy, respectively. Data are represented as mean ± standard deviation. *P < .05, **P < .01, ***P < .001