FIGURE 6.

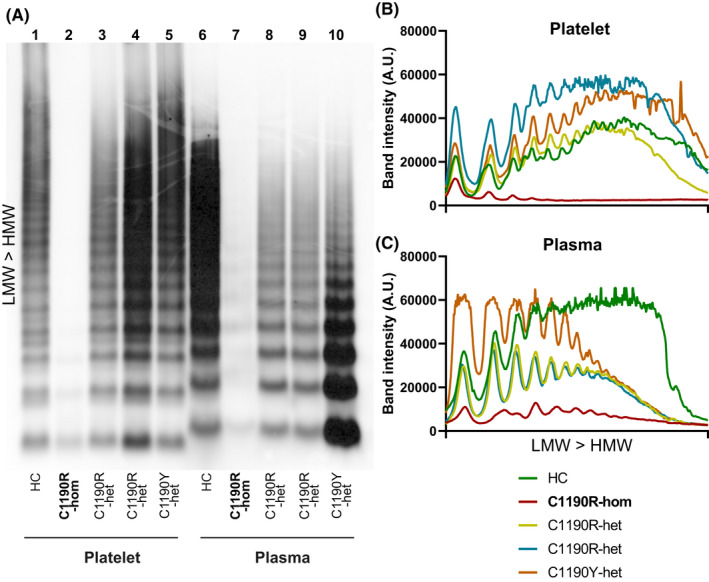
Von Willebrand factor (VWF) multimer analysis of patients with p.C1190. Platelets (lanes 1‐5) and plasma (lanes 6‐10) from a healthy control (HC) all patients with p.C1190 were analyzed for VWF multimer patterns (A). Patient with type 3 VWD (C1190R‐hom) is marked as bold text to distinguish from heterozygous C1190R (C1190R‐het) and C1190Y (C1190Y‐het). Line intensity plots were generated and plotted separately for platelet lysates (B) and plasma (C), with each individual color coded. Patterns were illustrated from low‐molecular‐weight (LMW) to high‐molecular‐weight (HMW) VWF multimers (B‐C), which is bottom to top on the blot (A)
