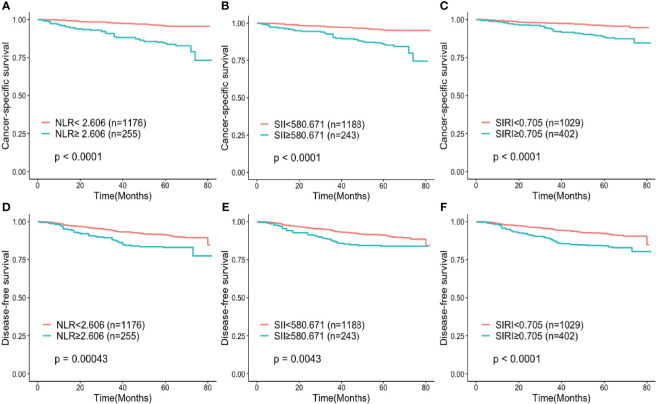
Figure 1.
Kaplan–Meier curves for (A–C) cancer-specific survival and (D–F) disease-free survival according to NLR, SIRI and SII. (A, D) Patients were stratified by NLR group; (B, E) Patients were stratified by SII group; (C, F) Patients were stratified by SIRI group. NLR, neutrophil-to-lymphocyte ratio; SII, systemic immune-inflammation index; SIRI, systemic inflammation response index.

