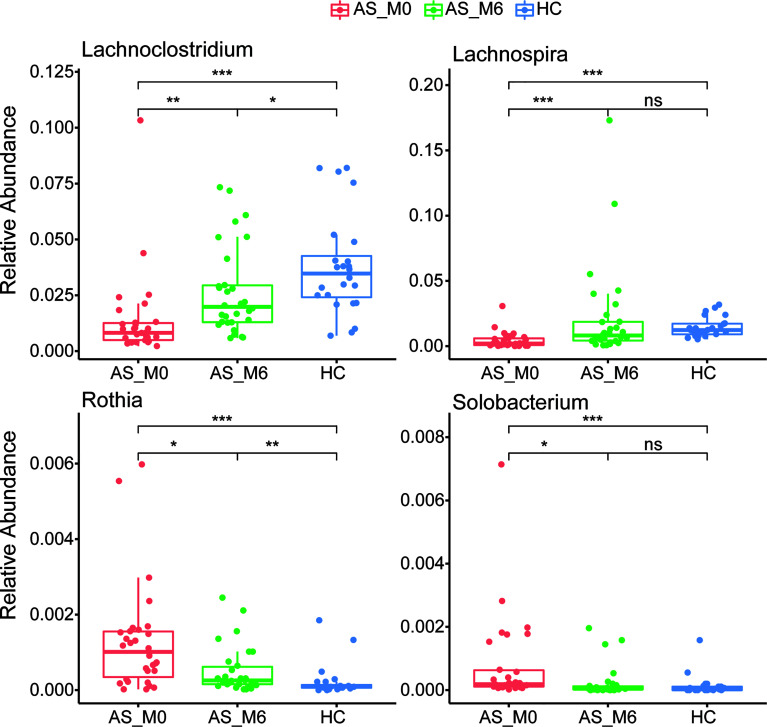
Figure 3.
Differential relative abundance of genera in AS patients before and after treatment. AS, ankylosing spondylitis. The horizontal bar within each box represents the median. The bottom and top of each box represent the 25th and 75th percentiles, respectively. The upper and lower whiskers extend to data no more than 1.5 × the IQR from the upper and lower edges of the box, respectively. *P < 0.05, **P < 0.01, ***P < 0.001, ns, P > 0.05.

