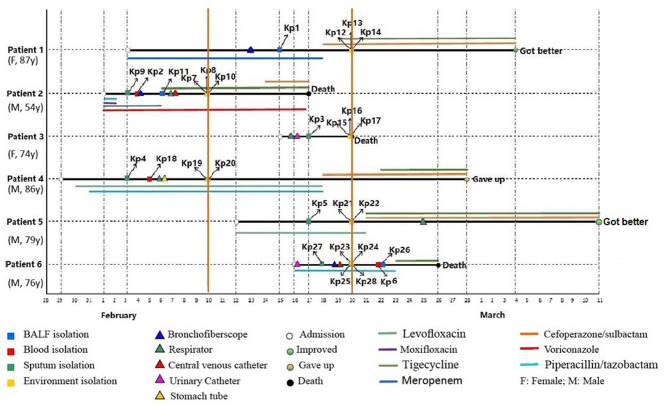
Figure 1.
Epidemiology of the CR-hvKP outbreak cases. Each horizontal line represents the timeline of one patient, with the abscissa axis showing the relevant dates. The isolates from different specimens and the traumatic treatment of these patients are represented by “□” and “Δ,” respectively. The outcome of the patients was represented by “O,” and the antibiotics used were represented by different color lines, and the length of the color lines represented the length of the antibiotic use.

