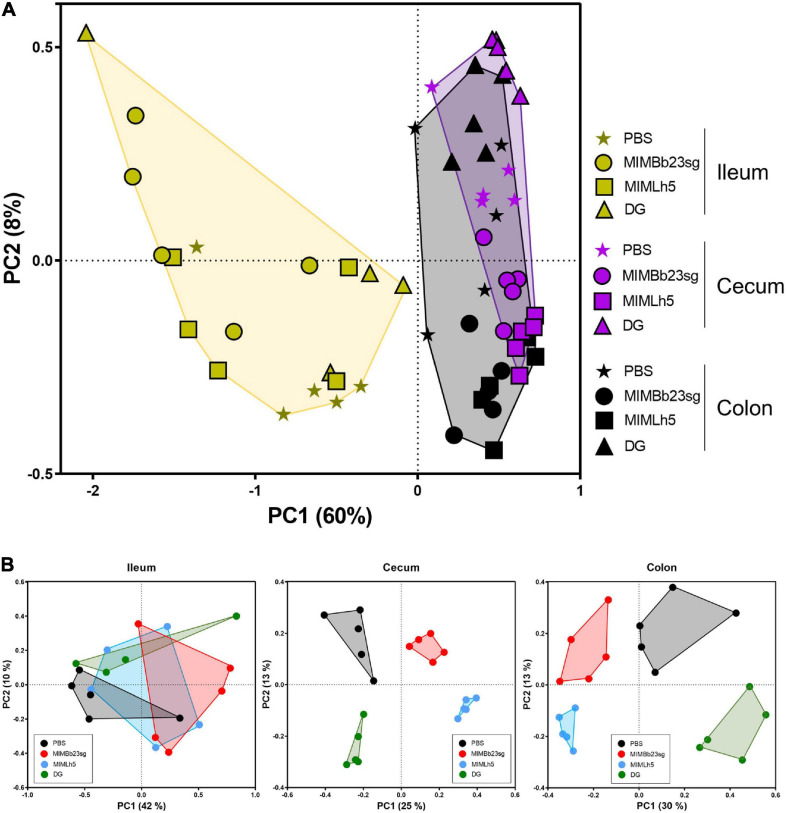
FIGURE 2.
Inter sample (β-) diversity of the microbiota in mouse intestinal sites shown as principal coordinates analysis of generalized UniFrac distances (α = 0.5) based on OTU abundances. Every symbol in the graphs refers to a single mouse. The first two coordinates (PC1 and PC2) are displayed with the percentage of explained variance in brackets. The analysis was performed with sample considered all together (A) or separated by intestinal site (B).

