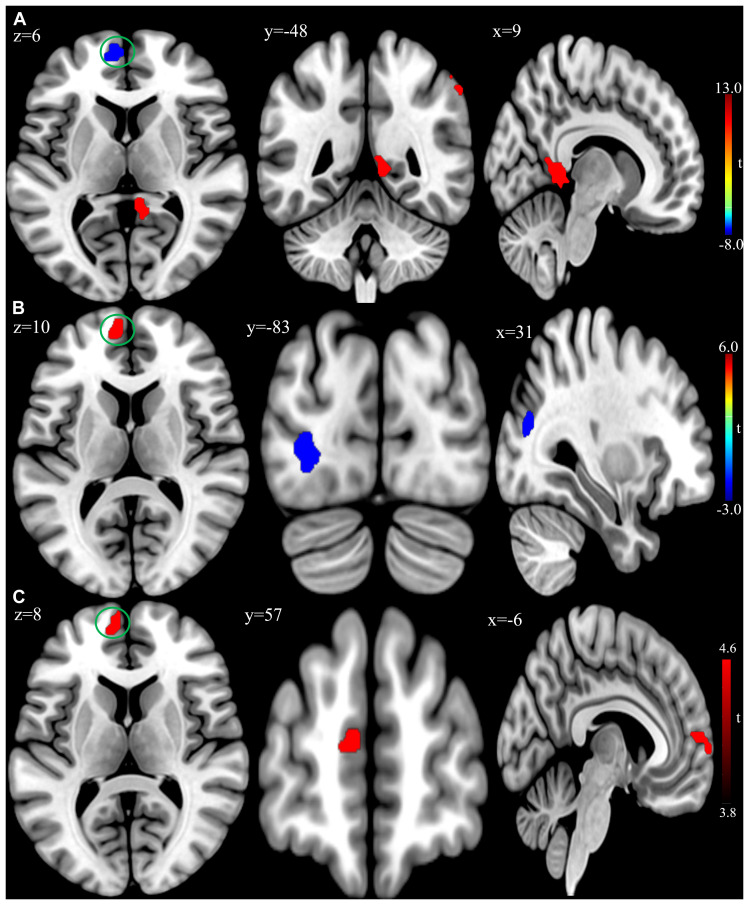
FIGURE 2.
(A) Brain regions showing significant differences of amplitude of low-frequency fluctuation (ALFF) between patient group and healthy control group at baseline. (B) Brain regions showing significant differences of ALFF between the posttreatment and baseline in the patient group. (C) Conjunction analysis maps of ALFF differences [(baseline vs. controls) ∩ (posttreatment vs. baseline)]. The warm color denoted the region where ALFF is higher, and the cool color denotes the region where ALFF is lower. The color circle denoted the overlapped region of ALFF differences.

