
FIGURE 2.
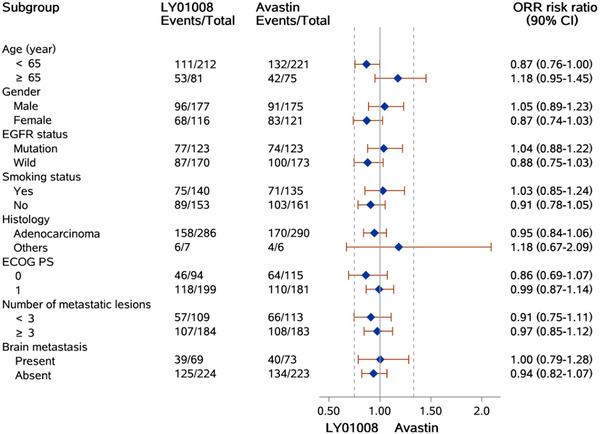
Forest plot for subgroup analysis of objective response rate in the full analysis set. Abbreviations: CI: confidence interval; ECOG: Eastern Cooperative Oncology Group; PS: performance status; EGFR, epidermal growth factor receptor
Official websites use .gov
A
.gov website belongs to an official
government organization in the United States.
Secure .gov websites use HTTPS
A lock (
) or https:// means you've safely
connected to the .gov website. Share sensitive
information only on official, secure websites.
Forest plot for subgroup analysis of objective response rate in the full analysis set. Abbreviations: CI: confidence interval; ECOG: Eastern Cooperative Oncology Group; PS: performance status; EGFR, epidermal growth factor receptor