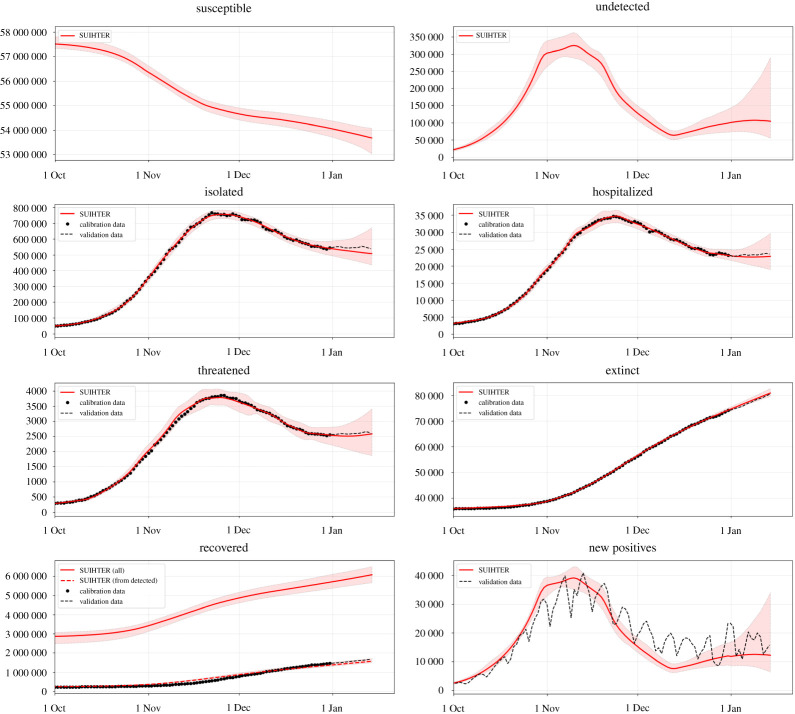
Figure 2.
Expected values (solid lines) and 95% prediction intervals (shaded areas) for the seven compartments of the SUIHTER model plus the additional daily new positives compartment. The data are indicated with black dots (in the calibration phase) and with a dashed line in the validation phase. (Online version in colour.)

