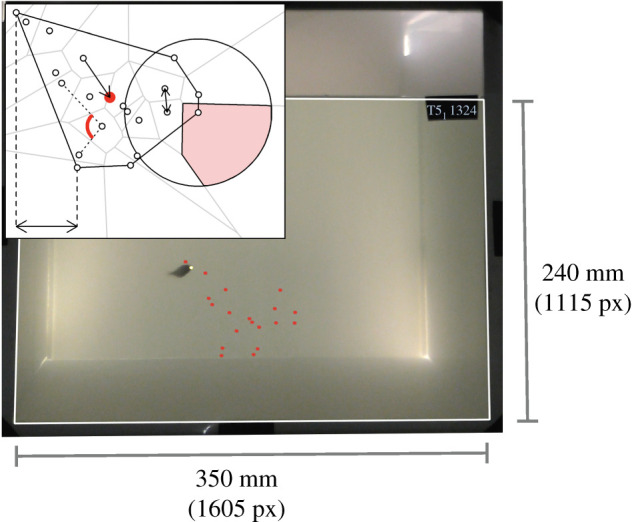
Figure 1.

Experimental set-up. Frame from an experimental trial showing the moment a stickleback attacks one of the virtual prey. Virtual prey (red and yellow dots) have been overlaid on this image, which are not visible in the camera footage (see electronic supplementary material, movie S3). The yellow prey indicates which prey was attacked, although all prey were projected as red dots in the trials. The white outline represents the projection area where prey could appear. The black oblong in the top right-hand corner of the arena shows the trial number and the time stamp of the simulation. These time stamps were used to determine the locations of the prey in the calibration videos, where prey were visible. The inset illustrates the measures of spatial position calculated from the prey positions. The grey lines show the Voronoi polygon for each prey. The large circle shows a radius around a prey within which its number of near neighbours is counted, and the shaded area of this circle shows that prey's limited domain of danger. The solid line around the group shows the convex hull. The double-headed arrow between two prey shows the nearest neighbour distance, and the single-headed arrow shows a distance to the group centroid (the red filled circle). The dashed vertical lines and double-headed arrow show a distance to the front of the group (the prey furthest to the left). The dotted lines and red arc show an angle of vulnerability. (Online version in colour.)
