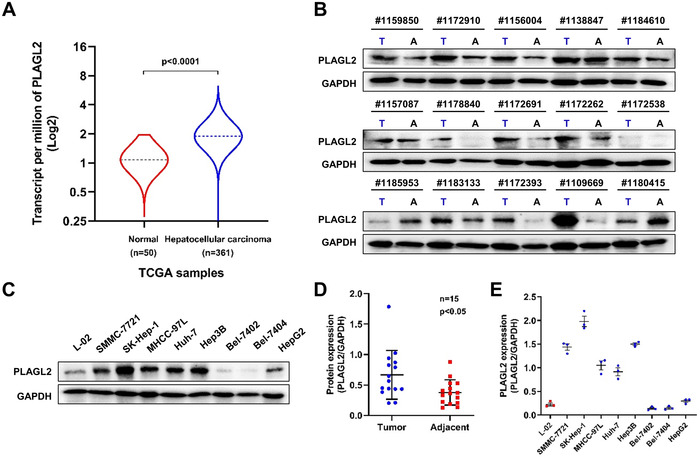
FIGURE 1.

PLAGL2 expression is upregulated in human HCC tissues and cells. (A) The expression of PLAGL2 was significantly higher in the 361 HCC tissues than in the 50 adjacent normal liver tissue samples in TCGA database, as analyzed using the UALCAN web tool. (B) Protein expression levels of PLAGL2 in 15‐paired HCC tissues were examined via western blotting. (C) Protein expression levels of PLAGL2 in eight HCC cell lines and normal hepatocyte L‐02 cells. (D) Quantification of (B), the data were normalized by GAPDH. E, Quantification of (C), the data were normalized using GAPDH as the control. Data are expressed as the means ± SEM (n = 3). p value < 0.05 was considered statistically significant. Abbreviations: A, adjacent; T, tumor
