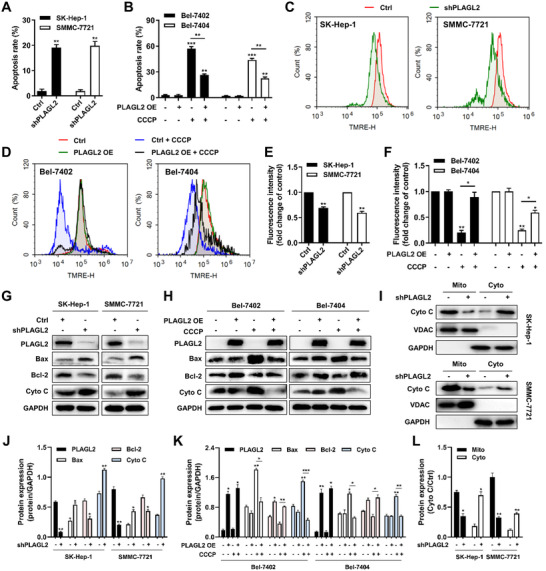
FIGURE 2.

PLAGL2 promotes the resistance of CCCP‐induced HCC cells apoptosis. (A) Knockdown of endogenous PLAGL2 expression in SK‐Hep‐1 and SMMC‐7721 cells induced cell apoptosis. Cell apoptosis was measured via Annexin V‐PE/7AAD staining in wild‐type control (Ctrl) and PLAGL2‐knockdown (shPLAGL2) SK‐Hep‐1 and SMMC‐7721 cells. The percentage of apoptotic cells was indicated. The results shown were representative of three independent experiments. (B) Overexpression of PLAGL2 in Bel‐7402 and Bel‐7404 cells promoted resistance of CCCP‐induced cells apoptosis. Wild‐type control (Ctrl) or PLAGL‐overexpressing (PLAGL2 OE) Bel‐7402 and Bel‐7404 cells were treated with 25 μM CCCP for 24 h. (C) Knockdown of endogenous PLAGL2 expression in SK‐Hep‐1 and SMMC‐7721 cells induced the loss of mitochondrial membrane potential (Δψm). Δψm was assessed through the retention of the dye TMRE using flow cytometry. (D) Overexpression of PLAGL2 in Bel‐7402 and Bel‐7404 cells restored the normal Δψm values in the presence of CCCP. E, Quantification histogram of (C) based on TMRE fluorescence intensity (fold change of control). (F) Quantification histogram of (D) based on TMRE fluorescence intensity (fold change of control). (G) Western blotting analysis for Bax, Bcl‐2, and Cyto C expression in the Ctrl/SK‐Hep‐1, shPLAGL2/SK‐Hep‐1, Ctrl/SMMC‐7721, and shPLAGL2/SMMC‐7721 cells. (H) Western blotting analysis for Bax, Bcl‐2 and Cyto C expression in the CCCP‐treated Ctrl/Bel‐7402, PLAGL2/Bel‐7402, Ctrl/Bel‐7404, and PLAGL2/Bel‐7404 cells. (I) Cell lysates of Ctrl/SK‐Hep‐1, shPLAGL2/SK‐Hep‐1, Ctrl/SMMC‐7721, and shPLAGL2/SMMC‐7721 cells were divided into mitochondrial and cytoplasmic fractions. Cyto C levels were measured by western blotting. GAPDH and VDAC served as controls. (J) Bar plot of (G.) (K) Bar plot of (H). (L) Bar plot of (I). Data are expressed as the means ± SEM (n = 3). *p < 0.05, **p < 0.01, ***p < 0.001 compared with the control group
