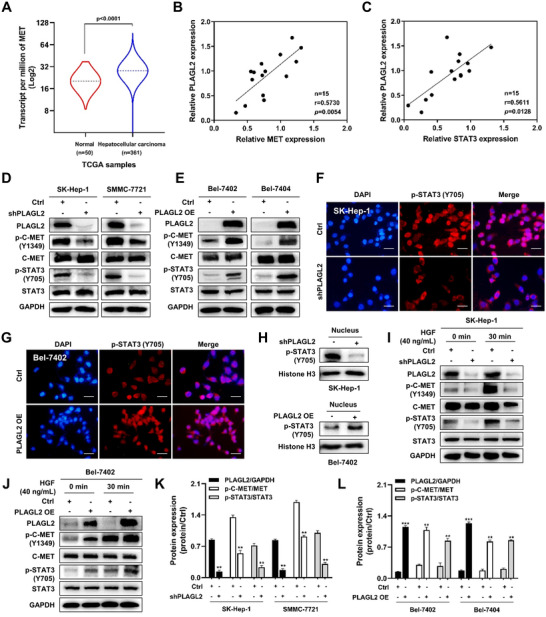
FIGURE 3.

PLAGL2 regulates the C‐MET/STAT3 signaling axis. (A) The expression of MET was significantly higher in the 361 HCC tissues than in the 50 adjacent normal liver tissue samples in TCGA database as analyzed using the UALCAN web tool. (B) The positive correlation between the mRNA expression of PLAGL2 and MET in 15 paired HCC tumor tissues. (C) The positive correlation between the mRNA expression of PLAGL2 and STAT3 in 15 paired HCC tumor tissues. (D) C‐MET and STAT3 expression levels following PLAGL2‐knockdown in the two HCC cell lines (Ctrl/SK‐Hep‐1, shPLAGL2/SK‐Hep‐1, Ctrl/SMMC‐7721, and shPLAGL2/SMMC‐7721) were detected at the total and phosphorylated protein levels via western blotting. (E) Total and phosphorylated C‐MET and STAT3 protein levels following PLAGL2‐overexpression in two HCC cell lines (Ctrl/Bel‐7402, PLAGL2/Bel‐7402, Ctrl/Bel‐7404, and PLAGL2/Bel‐7404). The nuclear translocation of p‐STAT3 (Y705) was impeded in PLAGL2‐knockdown SK‐Hep‐1 cells (F) but was markedly promoted in PLAGL2‐overexpressing Bel‐7402 cells (G) as revealed via immunofluorescence microscopy (the scale bar represents 100 μm). (H) Nuclear fractions of Ctrl/SK‐Hep‐1, shPLAGL2/SK‐Hep‐1, Ctrl/SMMC‐7721, and shPLAGL2/SMMC‐7721 cells were extracted. p‐STAT3 (Y705) levels were measured via western blotting. Histone H3 served as control. I, Ctrl/SK‐Hep‐1 and shPLAGL2/SK‐Hep‐1 cells were cultured in serum‐free MEM for 24 h, and then exposed to HGF (40 ng/ml) for 30 min, followed by western blotting with primary antibodies against PLAGL2, p‐C‐MET (Y1349), C‐MET, p‐STAT3 (Y705), and STAT3. (J) Ctrl/Bel‐7402 and PLAGL2/Bel‐7402 cells were cultured in serum‐free RPMI‐1640 for 24 h, and then exposed to HGF (40 ng/ml) for 30 min, followed by western blotting with the indicated primary antibodies. (K) Bar plot of (D). L, Bar plot of (E). Data are expressed as the means ± SEM (n = 3). **p < 0.01, ***p < 0.001 compared with the control group
