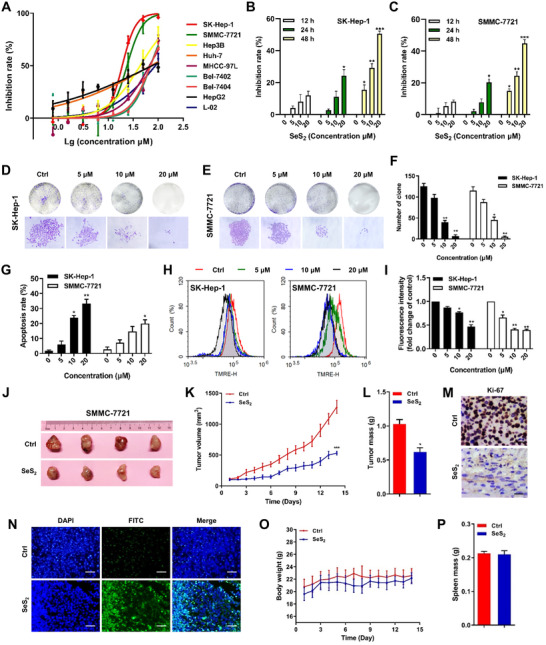
FIGURE 4.

Selenium sulfide inhibits the proliferation and induces the mitochondrial apoptosis of HCC cells in vitro and in vivo. (A) Effect of SeS2 on the proliferation of SK‐Hep‐1, SMMC‐7721, MHCC‐97L, Huh‐7, Hep3B, Bel‐7402, Bel‐7404, HepG2, and normal hepatocyte L‐02 cells. Cells were treated with SeS2 (0.78125‐100 μM) for 48 h, and cytotoxicity was analyzed using the MTT assay. SK‐Hep‐1 (B) and SMMC‐7721 (C) cells were treated with 5, 10, and 20 μM SeS2 for 12, 24, 48 h and cell viability were assessed using the MTT assay. The effects of SeS2 on the colony formation of SK‐Hep‐1 cells (D) and SMMC‐7721 cells (E). The colony formation (upper line) and the individual colonies (lower line) were photographed (200 × magnification). (F) Quantification histogram of (D) and (E). (G) Effects of SeS2 on the apoptosis of SK‐Hep‐1 and SMMC‐7721 cells. The apoptosis ratio was measured via flow cytometry analysis using Annexin V‐PE/7AAD double staining. (H) Effects of SeS2 on the Δψm. Δψm was assessed through the retention of the dye TMRE using flow cytometry. (I) Quantification histogram of (H) based on TMRE fluorescence intensity (fold change of control). (J) Images of tumors excised from four nude mice at 14 days after intraperitoneal injection of saline solution or SeS2 (5 mg/kg) in SMMC‐7721 xenograft tumors. (K) Volume changes of SMMC‐7721 tumors were measured every day. (L) Effects of SeS2 treatment on the masses of SMMC‐7721 tumors. (M) Representative images of the immunohistochemical analysis of Ki‐67 expression in SMMC‐7721 xenograft samples. The scale bar represents 50 μm. (N) Representative images of the TUNEL assay in SMMC‐7721 xenograft samples. The scale bar represents 200 μm. (O) Body weight changes in mice harboring SMMC‐7721 tumors. (P) Spleen mass of mice harboring SMMC‐7721 xenograft tumors. Data are expressed as the means ± SEM (n = 4). *p < 0.05, **p < 0.01, ***p < 0.001 compared with the control group
