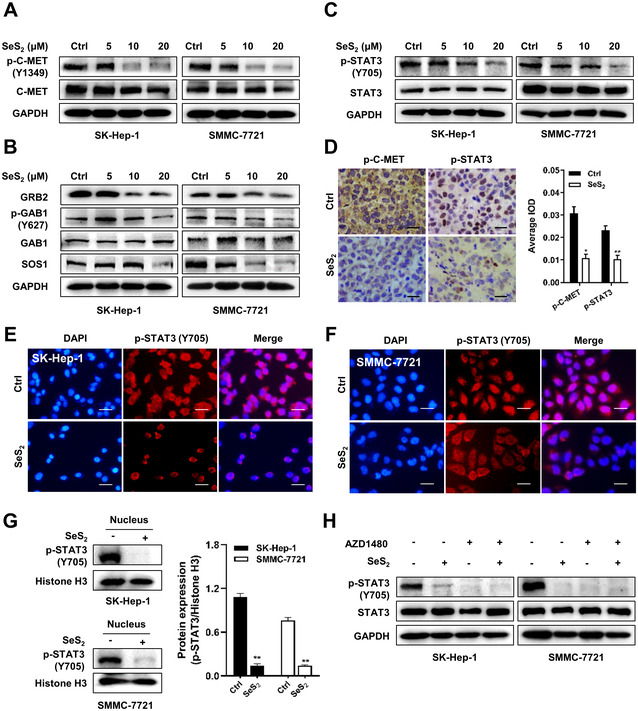
FIGURE 6.

Selenium sulfide inhibits the C‐MET/STAT3 signaling axis. (A) Protein expression of p‐C‐MET (Y1349) and C‐MET in SK‐Hep‐1 and SMMC‐7721 cells treated with SeS2 for 48 h. (B) Protein expression of GRB2, p‐GAB1 (Y627), GAB1, and SOS1 in SK‐Hep‐1 and SMMC‐7721 cells treated with SeS2 for 48 h. (C) Protein expression of p‐STAT3 (Y705) and STAT3 in SK‐Hep‐1 and SMMC‐7721 cells treated with SeS2 for 48 h. (D) Representative images of the immunohistochemical analysis of p‐C‐MET and p‐STAT3 expression in SMMC‐7721 xenograft samples, the scale bar represents 50 μm. Representative images of the immunofluorescence analysis of p‐STAT3 (Y705) protein in SK‐Hep‐1 (E) and SMMC‐7721 (F) cells treated with SeS2 (20 μM) for 48 h. p‐STAT3 (Y705) (red), DAPI (blue) staining, and merged images indicated the nuclear translocation and expression of p‐STAT3. The scale bar represents 100 μm. (G) Nuclear fractions of Ctrl and SeS2‐treated (20 μM) SK‐Hep‐1 and SMMC‐7721 cells were extracted. p‐STAT3 (Y705) levels were measured via western blotting. Histone H3 served as control. H, Protein expression of p‐STAT3 (Y705) and STAT3 in SK‐Hep‐1 and SMMC‐7721 cells after treatment with 20 μM SeS2 for 48 h in the presence of 3 μM AZD1480 for 12 h. Data are expressed as the means ± SEM (n = 3). *p < 0.05, **p < 0.01 compared with the control group
