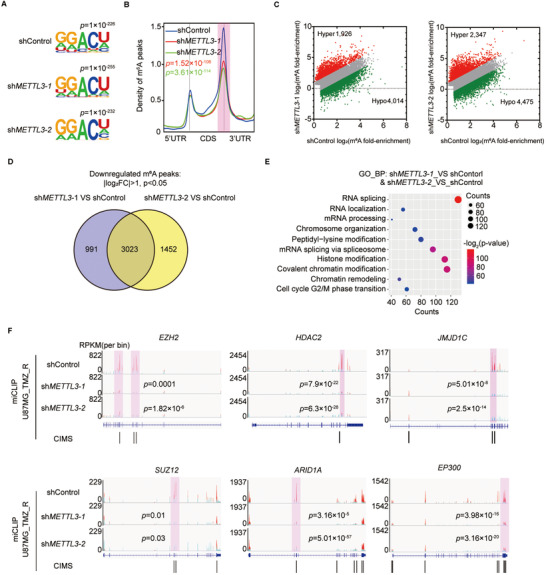
FIGURE 4.

METTL3 regulates the m6A level of histone modification factors. (A) Motif analysis of m6A modification peaks in METTL3 KD and control U87MG_TMZ_R cell miCLIP‐seq data. (B) Distribution of m6A modification peak reads across all mRNAs in METTL3 KD and control U87MG_TMZ_R cells. The levels of m6A modification near the stop codon (shadow) in METTL3 KD and control U87MG_TMZ_R cell were compared by Student's t‐test. (C) Scatter plot shows m6A enrichment on mRNAs in METTL3 KD and control U87MG_TMZ_R cells. (D) Venn diagram indicates the shared 3023 genes with decreased m6A modification in shMETTL3‐treated U87MG_TMZ_R cell. (E) GO analysis of m6A modification reduced genes in U87MG_TMZ_R cells upon METTL3 silencing. (F) IGV plots of m6A peaks at the gene loci of histone modifiers in METTL3 KD and control U87MG_TMZ_R cells. The y‐axis shows the normalized RPKM (per bin, bin = 25 bp) value. Exomepeak R package was used for statistical comparison. CIMS, crosslinking‐induced mutation sites
