FIGURE 5.

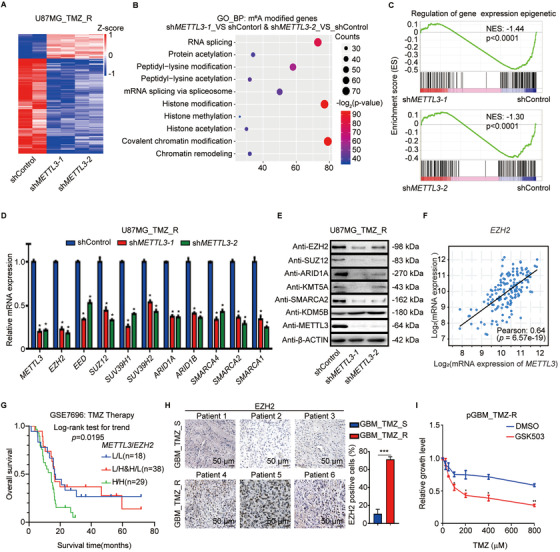
METTL3 regulates the expression of histone modification factors. (A) Heatmap shows the mRNA expression changes in U87MG_TMZ_R cells upon METTL3 silencing. Z‐score = log2(x/μ), μ means the average RPKM value of a set of data. (B) GO analysis of downregulated m6A modified genes in U87MG_TMZ_R cells upon METTL3 silencing. (C) GSEA plots of differentially regulated genes between shMETTL3‐treated and control cells. (D) RT‐qPCR analysis of the indicated mRNAs in U87MG_TMZ_R cells with or without METTL3 silencing. (E) Immunoblotting of the indicated proteins in U87MG_TMZ_R cells transduced with shMETTL3 and control shRNA. (F) Analysis of the correlation between METTL3 and EZH2 mRNA expression levels in GBM patients from TCGA database. (G) Overall survival curve of GBM patients divided by different combinations of METTL3 and EZH2 expression (L/L, low EZH2 and METTL3 expression; L/H&H/L, low EZH2 expression and high METTL3 expression & high EZH2 expression and low METTL3 expression; H/H, high EZH2 and METTL3 expression). (H) IHC staining of EZH2 in TMZ‐resistant GBM samples (n = 3) and comparison with TMZ‐sensitive GBM samples (n = 3). The statistical results showed the proportion of EZH2‐positive cells in each group. (I) Cell viability assays of primary TMZ‐resistant GBM cells treated with the inhibitor of EHZ2 (GSK503) and different concentrations of TMZ. *P < 0.05; **P < 0.01, compared to control (Student's t‐test). All the results were obtained from three independent experiments. Values are presented as mean ± SD
