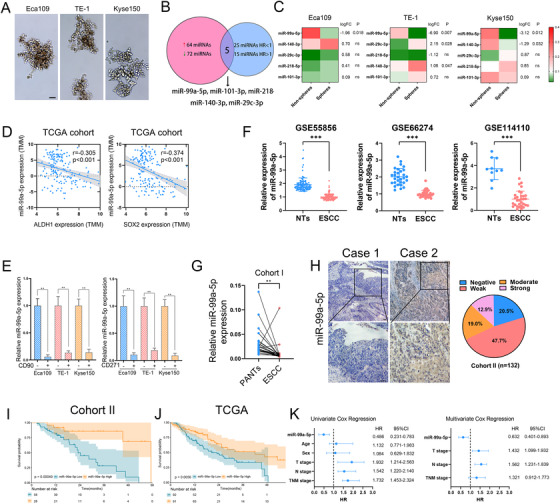
FIGURE 1.

miR‐99a‐5p is downregulated in esophageal squamous cell carcinoma (ESCC), and its expression correlates closely with cancer stem‐like cell (CSC) properties of ESCC (A) Representative images of spheres of indicated ESCC cells enriched by serially replating in ultralow attachment plates. Scale bars: 100 μm. (B) Venn diagram showing overlap microRNAs (miRNAs) that both dysregulated and are survival‐predictable in ESCC. (C) Heatmap showing the expression of five overlapped miRNAs relative to 5S rRNA as determined by multiplex quantitative real‐time PCR (qRT‐PCR). Log fold change represents log2 fold change of miRNA expression between spheres and non‐spheres. (D) Correlation between miR‐99a‐5p and ALDH1 (left) and SOX2 (right) mRNA levels in patients in the The Cancer Genome Atlas (TCGA) dataset. (E) Cells were first sorted based on the expression of CD90+ and CD271+, then, miR‐99a‐5p expression in CD90+ (left) and CD271+ (right)‐enriched cell populations was detected by qRT‐PCR. (F) Expression profile of miR‐99a‐5p in ESCC tissues and nontumorous tissues derived from the Gene Expression Omnibus dataset. NTs, Non‐tumorous tissues. (G) miR‐99a‐5p expression in 26 paired ESCC tissues and PANTs was measured by qRT‐PCR; 5S rRNA was used as an internal control. PANTs, paired adjacent non‐tumorous tissues. (H) Representative images of in situ hybridization (ISH) staining for miR‐99a‐5p expression in ESCC tissues. Negative (staining index (SI) < 3), weak (3 < SI < 6), moderate (6 < SI < 10), strong (SI > 10). Scale bars: 100 μm. (I‐J) Kaplan–Meier overall survival (OS) analysis of miR‐99a‐5p expression in ESCC tissues in Cohort II (left) and from patients in the TCGA cohort (right). (K) Univariate and multivariate Cox regression analyses showed that miR‐99a‐5p was an independent prognostic factor in ESCC. The data represent the mean ± SD. *p < 0.05, **p < 0.01, ***p < 0.001. p‐values were determined by unpaired Student's t‐test (E and F), paired Student's t‐test (G), and log‐rank test (I and J). The correlation was determined by the Pearson correlation test (D)
