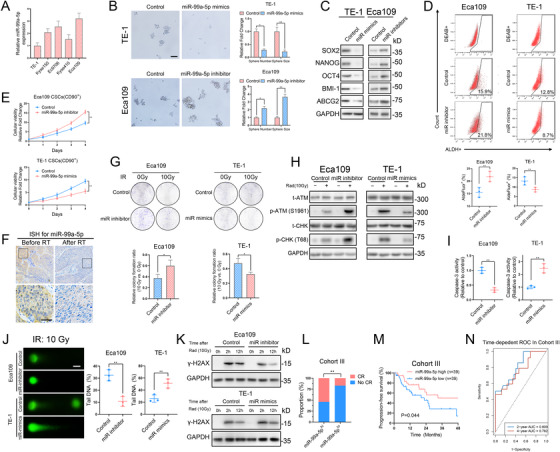
FIGURE 2.

miR‐99a‐5p suppresses CSC properties and radioresistance of ESCC cells (A) Relative expression of miR‐99a‐5p in ESCC cell lines (Eca109, Ec9706, Kyse410, Kyse150, and TE‐1) as detected by qRT‐PCR. (B) Representative images (left) and statistical quantification (right) of sphere formation by the indicated ESCC cells. Scale bars: 100 μm. (C) Western blotting analysis of CSC markers in the indicated ESCC cells. (D) Representative images (upper) and statistical quantitation (lower) of the results of flow cytometric analysis for determination of ALDH activity in the indicated ESCC cells. (E) Cell viability assay of the CD90+‐enriched cell population in the indicated ESCC cells. (F) Representative images showing ISH staining of miR‐99a‐5p in ESCC tissues from patients at Tongji Hospital before and after radiotherapy. Scale bars: 100 μm. (G) Representative images (upper) and statistical quantification (lower) showing colony formation by the indicated ESCC cells after ionizing radiation (IR) at a dose of 10 Gy. (H) Western blotting analysis of the total and phosphorylated proportion of checkpoint markers ATM and CHK in the indicated ESCC cells 4 h after IR at a dose of 10 Gy. (I) Relative caspase‐3 activity in the indicated ESCC cells 24 h after IR at a dose of 10 Gy. (J) Representative images (left) and statistical quantification (right) of the comet assay results in the indicated ESCC cells 6 h after IR at a dose of 10 Gy. Scale bars: 10 μm. (K) After IR at a dose of 10 Gy, the indicated ESCC cells were cultured under normal conditions for 2 and 12 h, and γ‐H2AX expression in each group was determined by western blotting. (L) Patients with higher miR‐99a‐5p expression were more likely to respond well to radiotherapy than those with low miR‐99a‐5p expression. (M) K‐M plot showing the relationship between miR‐99a‐5p levels and patient progression‐free survival (PFS) in Cohort III. (N) The time‐dependent ROC analysis of patients in Cohort III revealed that miR‐99a‐5p was an independent factor for predicting 2‐ and 4‐year PFS. The data represent the mean ± SD. *p < 0.05, **p < 0.01, ***p < 0.001. p‐values were determined by unpaired Student's t‐test (B, D, E, G, I, and J), the log‐rank test (M), and Fisher's exact test (L)
