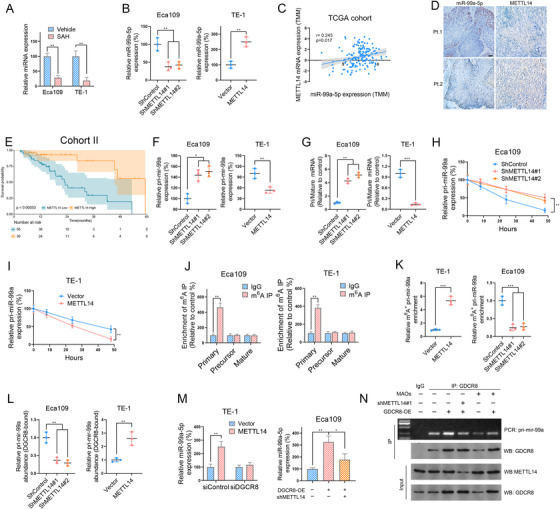
FIGURE 3.

Methyltransferase‐like 14 (METTL14)‐mediated methyladenosine (m6A) methylation m6A modification regulates miR‐99a‐5p expression in ESCC (A) miR‐99a‐5p expression in Eca109 and TE‐1 cells after treatment with or without S‐adenosylhomocysteine (5 μM) was measured by RT‐PCR. (B) METTL14 overexpression increased, whereas METTL14 knockdown decreased, miR‐99a‐5p expression in ESCC cells as measured by RT‐PCR. (C) Correlation between miR‐99a‐5p and METTL14 mRNA levels in ESCC tissues from patients in the TCGA dataset. (D) Immunohistochemistry (IHC) and ISH showing that METTL14 expression positively correlated with the miR‐99a‐5p level in ESCC tissues obtained from patients at Tongji Hospital. Scale bars: 50 μm. (E) Kaplan–Meier OS analysis of METTL14 expression in ESCC tissues obtained from patients at Tongji Hospital. (F) METTL14 overexpression reduced, whereas METTL14 silencing upregulated, pri‐mir‐99a expression in ESCC cells as detected by RT‐PCR. (G) Ratio of pri‐mir‐99a expression to mature miR‐99a‐5p expression in ESCC cells as determined by RT‐PCR. (H‐I) The indicated ESCC cells were treated with actinomycin D (5 μg/ml) for the indicated time periods, and the expression level of pri‐mir‐99a was measured by qRT‐PCR. (J) N6‐m6A‐RNA immunoprecipitation (MeRIP)‐qPCR analysis of primary, precursor, and mature miR‐99a‐5p in Eca109 and TE‐1 cells. (K) MeRIP‐qPCR analysis of pri‐mir‐99a after METTL14 knockdown or overexpression in the indicated ESCC cells. (L) The levels of DiGeorge critical region 8‐dependent (DGCR8)‐bound pri‐mir‐99a in the indicated ESCC cells after METTL14 knockdown or overexpression were determined by IP of DGCR8‐associated RNA followed by RT‐PCR. (M) The expression of mature miR‐99a‐5p in ESCC cells transfected with the indicated constructs was determined by qPCR. (N) RIP assays for detecting the interaction between DGCR8 and pri‐mir‐99a. Bottom, IP efficiency of the DGCR8 antibody. Top, the abundance of DGCR8‐associated pri‐mir‐99a was analyzed by qPCR and normalized to the input control. The data are presented as the mean ± SD. *p < 0.05, **p < 0.01, ***p < 0.001. p‐values were determined by one‐way ANOVA with Tukey's post hoc test (B, F, G, H, K, L, and M), unpaired Student's t‐test (A, B, F, G, I, J, K, L, and M) or the log‐rank test (E). Correlations were determined by the Pearson correlation test (C)
