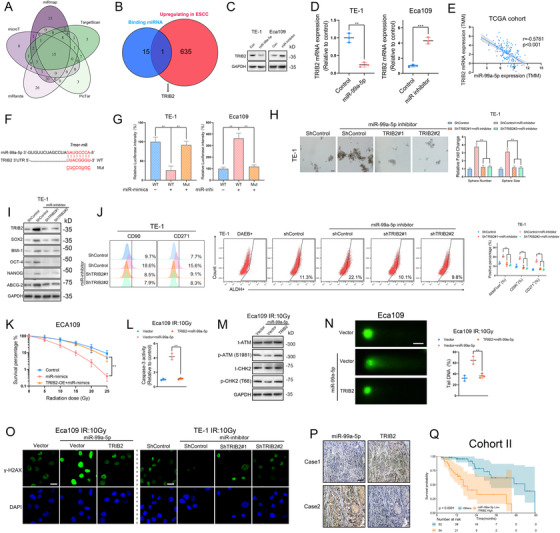
FIGURE 4.

TRIB2 is the downstream target of miR‐99a‐5p, which promotes cancer cell stemness and radioresistance of ESCC (A) Venn diagram showing mRNAs that possesses miR‐99a‐5p binding sites in its 3′ untranslated region (3′ UTR) derived from the combined analysis of five web‐based databases (miRmap, microT, miRanda, PicTar, and TargetScan). mRNAs predicted to bind with miR‐99a‐5p that were common to all databases were selected as candidate mRNAs. (B) Venn diagram showing mRNAs that had both upregulated expression in ESCC and potential binding sites for miR‐99a‐5p. (C‐D) The indicated ESCC cells were transfected with control RNA, miR‐99a‐5p mimics, or miR‐99a‐5p inhibitor, and the protein and mRNA levels of TRIB2 were determined by western blotting (C) and RT‐PCR (D). (E) Correlation between tribble 2 (TRIB2) and miR‐99a‐5p expression in patients in the TCGA cohort. (F) Schematic representation of the miR‐99a‐5p‐binding region within the 3′ UTR of TRIB2 mRNA as predicted by starBase (http://starbase.sysu.edu.cn). (G) ESCC cells were cotransfected with control RNA, miR‐99a‐5p mimics, or miR‐99a‐5p inhibitor, and with the wild‐type (WT) 3′ UTR of TRIB2 or mutant‐type (Mut) TRIB2 3′ UTR. The firefly luciferase values were normalized to the intensity of Renilla luciferase. (H) Representative images (left) and statistical quantification (right) of sphere formation by the indicated ESCC cells. Scale bars: 100 μm. (I) Western blotting analysis of CSC markers in the indicated ESCC cells. (J) Representative images and statistical quantification of the results of flow cytometric analyses to determine the ALDH activity and the relative proportions of CD90‐positive and CD271‐positive subpopulations in the indicated ESCC cells. (K) Clonogenic assay of Eca109 cells transfected with the indicated construct after an IR dose of 10 Gy. The survival fraction was calculated as (number of colonies formed/number of cells plated)irradiated/(number of colonies formed/number of cells plated)control. (L) Relative caspase‐3 activity of the indicated ESCC cells 24 h after an IR dose of 10 Gy. (M) Western blotting analysis of the phosphorylated and total amounts of the checkpoint markers ATM and CHK in the indicated ESCC cells 4 h after an IR dose of 10 Gy. (N) Representative images (left) and statistical results (right) of the comet assay in the indicated ESCC cells 6 h after an IR dose of 10 Gy. Scale bars: 10 μm. (O) Immunofluorescence staining of γ‐H2AX in the indicated ESCC cells 12 h after an IR dose of 10 Gy. Scale bars: 10 μm. (P) Representative images showing IHC staining for TRIB2 and ISH detection of miR‐99a‐5p in ESCC patients at Tongji Hospital. Scale bars: 100 μm. (Q) Kaplan–Meier OS analysis of ESCC patients at Tongji Hospital with the corresponding expression profiles. The data are presented as the mean ± SD. *p < 0.05, **p < 0.01, ***p < 0.001. p‐values were determined by unpaired Student's t‐test (D), one‐way ANOVA with Tukey's post hoc test (G, H, J, K, L, and N), and the log‐rank test (Q). Correlations were determined by the Pearson correlation test (E)
