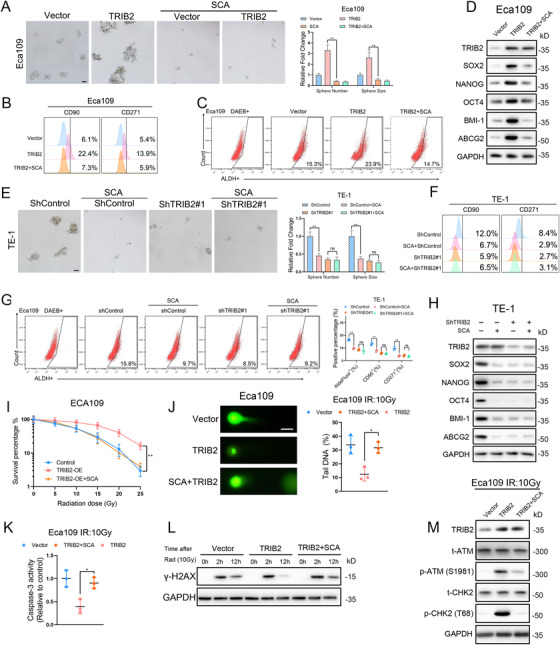
FIGURE 7.

HDAC2 is essential for the TRIB2‐mediated CSC properties and radioresistance of ESCC cells (A) Representative images (left) and statistical quantification (right) of sphere formation in the indicated ESCC cells treated with or without the HDAC2 inhibitor (SCA, 2 μM). Scale bars: 100 μm. (B–C) Representative images and statistical quantification of the flow cytometric analysis determining the ALDH activity and proportion of the CD90‐positive and CD271‐positive subpopulations in the indicated ESCC cells treated with or without HDAC2 inhibitor (SCA, 2 μM). (D) Western blotting analysis of CSC markers in the indicated ESCC cells treated with or without the HDAC2 inhibitor (SCA, 2 μM). (E) Representative images (left) and statistical quantification (right) of sphere formation by the indicated ESCC cells treated with or without the HDAC2 inhibitor (SCA, 2 μM). Scale bars: 100 μm. (F‐G) Representative images and statistical quantification of the results of flow cytometric analyses to determine ALDH activity and the relative proportions of CD90+ and CD271+ cells in the indicated ESCC cells treated with or without HDAC2 inhibitor (SCA, 2 μM). (H) Western blotting analysis of CSC markers in the indicated Eca109 cells treated with or without an HDAC2 inhibitor (SCA, 2 μM). (I) Clonogenic assay of the indicated ESCC cells with or without an HDAC2 inhibitor (SCA, 2 μM) at an IR dose of 10 Gy. The survival fraction was calculated as (number of colonies formed/number of cells plated)irradiated/(number of colonies formed/number of cells plated)control. (J) Relative caspase‐3 activity in the indicated ESCC cells 24 h after an IR dose of 10 Gy. (K) Representative images (left) and statistical quantification (right) of the comet assay results in the indicated ESCC cells 6 h after an IR dose of 10 Gy. Scale bars: 10 μm. (L) After treatment with 10‐Gy IR, the indicated ESCC cells were cultured under normal conditions for 2 and 12 h, and γ‐H2AX expression in each group was detected by western blotting. (M) Western blotting analysis of the total and phosphorylated proportion of checkpoint markers ATM and CHK in the indicated ESCC cells 4 h after an IR dose of 10 Gy. The data are presented as the mean ± SD. *p < 0.05, **p < 0.01, ***p < 0.001. p‐values were determined by one‐way ANOVA with Tukey's post hoc test
