
FIGURE 1.
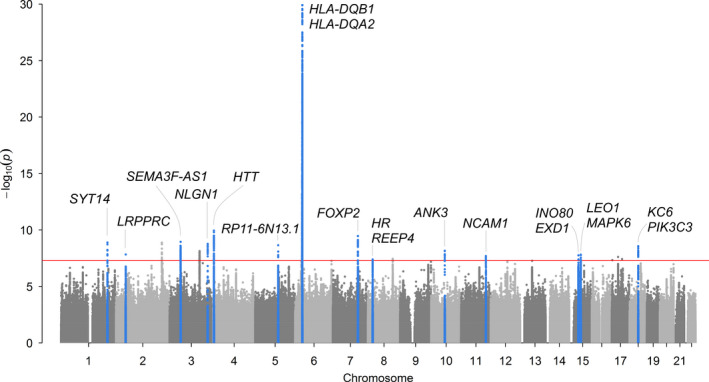
Manhattan plot for genome‐wide association study of Frailty Index. Meta‐analysis GWAS of Frailty Index (normalized) in 164,610 UK Biobank participants aged 60–70 of European descent and 10,616 TwinGene participants aged 41–87 years. Primary analysis included 7,666,890 autosomal variants with minor allele frequency (MAF) >0.1%. Hardy–Weinberg p‐value >1x10⁻⁹ and imputation quality >0.3 in both cohorts. Linear mixed‐effects regression models (BOLT‐LMM software (Loh et al., 2015), which accounts for relatedness and population structure), were adjusted for age, sex, assessment centre (22 categories) and genotyping array (2 categories: Axiom or BiLEVE). There are 14 loci associated with p<5*10−8 (red line) in the meta‐analysis, highlighted in blue. In secondary analysis of 8,828,853 variants only available in UK Biobank, 6 additional loci were associated p<5*10−8 (plotted but not highlighted). Genes are those nearest to the lead variants. See Table 2 for primary meta‐analysis results. See Tables S1 and S2 for full details