
FIGURE 3.
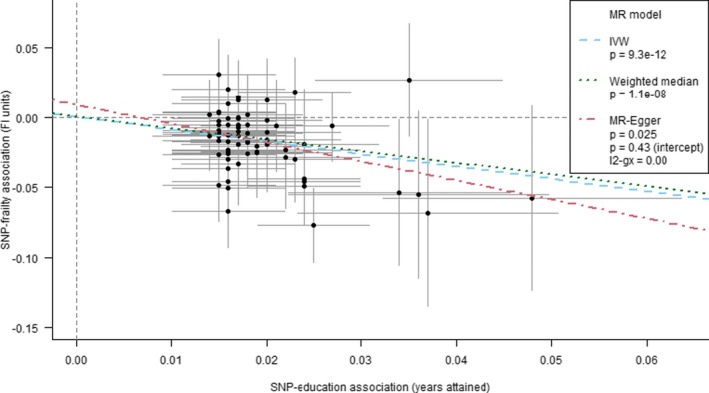
Mendelian randomization estimates for the effect of educational attainment on the frailty index in UK Biobank Points and error bars represent beta estimates and 95% confidence intervals for each SNP‐education / SNP‐FI association. The trend lines represent different methods for summarizing the estimates from individual SNPS—inverse variance weighting (IVW), weighted median and MR‐Egger. The weighted median and MR‐Egger estimates are less prone to bias from pleiotropy among the set of variants than IVW, given alternative assumptions hold. The MR‐Egger method includes a test of whether the trend's intercept differs from zero, which indicates whether there is an overall imbalance (directional) of pleiotropic effects: such bias was not identified in this education‐FI model